Monitoring a competitor who publishes no feed is the case every RSS guide skips. Twenty-one platforms sorted by which of three jobs they do, and the finished setup is business process automation you own outright, with no seat licence to renew.
Blaming the content is the reflex when a post underperforms, and it is usually the wrong diagnosis. A second reader decides distribution before any human sees the post, and most of what it checks is mechanical enough to automate business processes around, on five platforms at once.
Gloves on, tape measure in hand — nobody types a query. Three voice surfaces for ai automation tools (terminal, Telegram, Discord), 10 TTS and 6 STT providers compared on cost and latency, plus a setup that costs nothing.
How I Built an AI System That Turns One Keyword Into a Full TikTok Shop Market Report
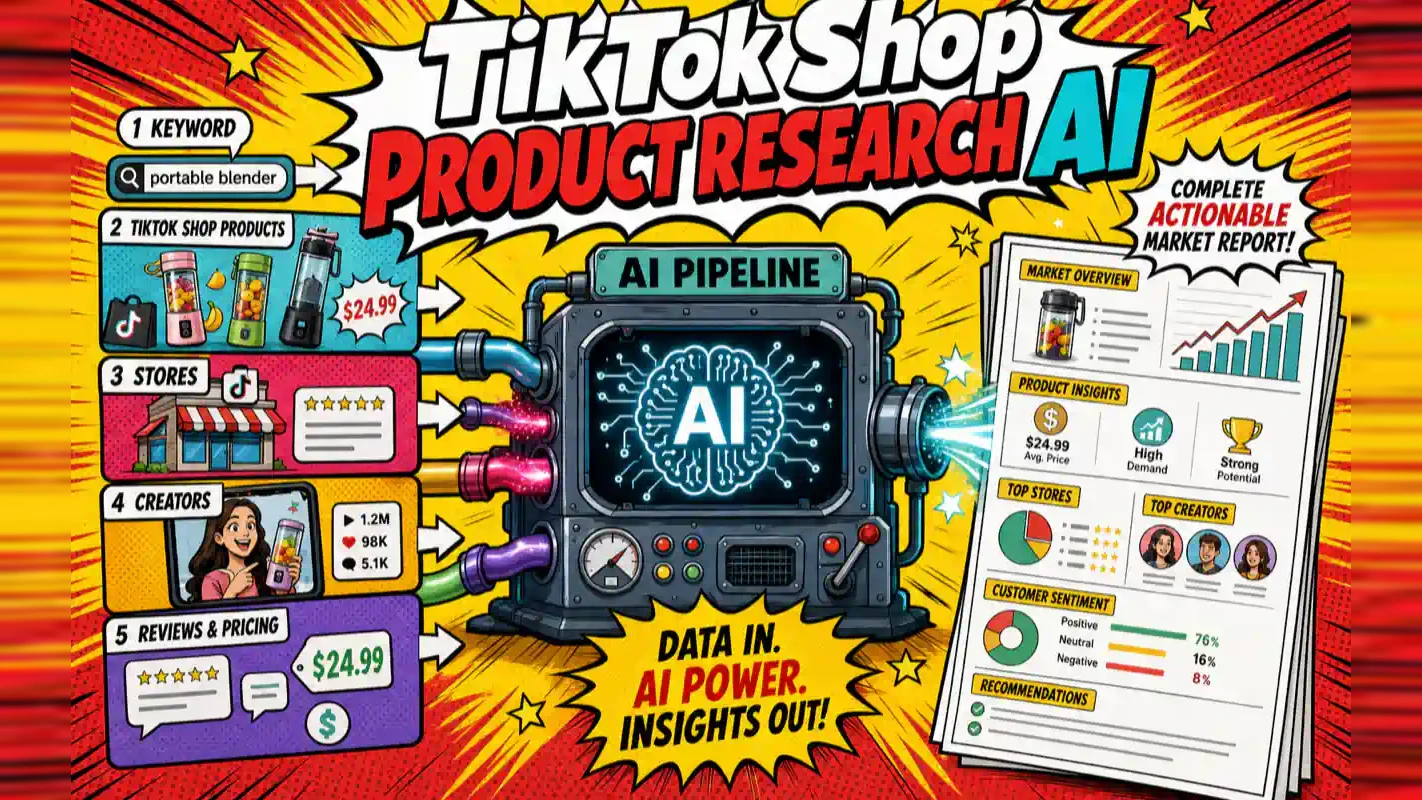
Most sellers pick products from whatever is trending. This system takes one keyword and returns a 600-line market report — product data, store strategies, creator analytics, pricing, and an 8-week action plan. The transferable part is the 11 named steps anyone can rerun.
TL;DR: I built an AI-powered product research system for TikTok Shop that takes a single keyword and produces a 600-line market analysis report. It runs 11 automated steps — scraping products, stores, creators, reviews, and pricing — then compresses ~750KB of raw data into a 20KB actionable report. Total runtime: about 3 minutes. This article breaks down the architecture, walks through a real case study ($6.6M bluetooth earbuds market), and gives you the prompt to build your own.
Everyone quotes the speed: three days of work down to three minutes. That is the least transferable number on the page. The one that carries over to any business is how many of the steps got written down, because a step nobody wrote down is a step only one person can run. Any agency that has built a new-client audit knows the shape of this: the senior person does it beautifully and cannot explain it, so every audit comes out slightly different and the junior version is missing the two checks that mattered. Business process automation begins where a judgment call becomes an ordered list someone else can follow.
Why Most TikTok Shop Sellers Get Product Research Wrong
Here is the uncomfortable truth about product research on TikTok Shop: most sellers pick products based on what shows up on their For You Page.
That is not product research. That is reacting.
I was guilty of this myself. I would see a product blowing up, think "I could sell that," and start sourcing before doing any real analysis. Three times in a row, I entered markets where the top sellers had spent months building creator networks and locking down supply chains. By the time I showed up, the margin was gone.
I was wrong about what "doing product research" meant. Checking a few competitor listings and eyeballing price points is not TikTok Shop product research — it is confirmation bias with extra steps.
The core problem is threefold:
You are always late. The "trending product" you see today was someone else's calculated bet three months ago. When I analyzed bluetooth earbuds on TikTok Shop, the market leader (MINISO MS105, $9.99, 7,260 units/week) had already deployed 619 creators producing 943 videos and 283 live streams. Entering that price point now means fighting a machine that is already running at full speed.
You see one dimension. Most sellers look at sales volume and stop there. But volume alone tells you nothing about margins, creator ecosystem maturity, review sentiment, or how defensible a position actually is. A product selling 3,980 units/week at $17.67 with a 15% affiliate commission rate and 80M+ impressions (like MSHUKCOE's sleep earbuds) can be a better opportunity than the volume leader — if you know where to look.
Data and decisions live in different places. Even when sellers do gather data, it sits in spreadsheets that never connect to an action plan. You end up with numbers but no next step.
I needed a product research system that could do three things: scan a TikTok Shop market quickly, analyze it deeply, and tell me what to do about it.
So I built one.
What This AI Product Research System Actually Does
Here is what happens when you give the system a keyword:
Input: One keyword (e.g., "bluetooth earbuds") and a target market (e.g., "US").
Process: 11 automated steps that collect product listings, bestseller rankings, store catalogs, product details, creator profiles, and customer reviews through Apify's data collection APIs. Three AI sub-agents then run competitive analysis, pricing analysis, and report generation.
Output: A structured 600-line Markdown report with three sections:
Market Overview (5-minute read) — Market sizing, top 10 products, top 5 stores, one-line verdict
Deep Analysis (15-minute read) — Bestseller teardowns, store strategy breakdowns, price band mapping, creator efficiency metrics, review sentiment
The entire run takes about 3 minutes of compute time. Doing this manually takes about 3 days.
How the Architecture Works: Three-Layer Data Aggregation
A full collection run — product search, bestseller lists, store catalogs, product details, creator data, review data — produces roughly 750KB of JSON. That is 750,000 characters, about the length of a short novel. You cannot read a novel to make a product sourcing decision.
I designed a three-layer compression architecture to solve this:
Layer 1: Raw Data (~750KB)
This is the unprocessed JSON from each API call. Every product field is preserved: ID, title, price, rating, sales volume, SKU variants, inventory counts, image URLs, creator partnership data, review text.
Its purpose is archival. When you need to trace a specific number back to its source, the raw data is there.
Layer 2: Step Summaries (~50KB)
After each collection step completes, the system auto-generates a summary. For example, after the product search step, it produces a search_summary.md containing:
Eight collection steps, each producing about 5KB of summary, total roughly 50KB.
Layer 3: Final Report (~20KB)
The three AI sub-agents synthesize all summaries into a single 600-line report with a fixed structure: Executive Summary → Market Overview → Deep Analysis → Action Guide → Appendix.
Each layer compresses at roughly 15:1. The net effect: 750KB → 50KB → 20KB. You do not read the novel. You read the 20-page executive brief.
This compression ratio is what makes the system practical. Without it, you would drown in data. With it, you get a document you can read in 30 minutes and act on immediately.
The 11-Step Pipeline: What Gets Collected and Why
The pipeline is not randomly structured. It follows the three questions every product selection decision must answer:
What should I sell? (Product layer)
How should I sell it? (Pricing and store strategy layer)
Who should sell it for me? (Creator and review layer)
Each question maps to a group of collection steps:
What Should I Sell? (Steps 2–6)
Step
What It Does
Runtime
Step 2: Product Search
Keyword search across TikTok Shop listings. Returns ~100 products with price, rating, and sales data
~20s
Step 3: Bestseller Rankings
Pulls the category bestseller list to identify weekly volume leaders
~7s
Step 4: Store Extraction
Identifies 5 representative stores from bestseller products
~5s
Step 5: Store Catalog Scrape
Collects full product listings from those 5 stores to understand their product line strategy
~60s
Step 6: Product Details
Deep-dives into Top 10 products: SKU variants (sizes, colors, bundles), inventory counts, images
~35s
Who Should Sell It? (Steps 7–8)
Step
What It Does
Runtime
Step 7: Creator Data
Scrapes creator profiles associated with top products: follower tiers, video counts, live stream counts, impressions
~25s
Step 8: Review Data
Collects product reviews and runs sentiment analysis: positive/negative ratio, pain point categorization
~10s
How Should I Sell It? (Steps 9–10)
Step
What It Does
Runtime
Step 9: Competitive Analysis
AI sub-agent builds a product competitiveness matrix and store strategy breakdown from all previous summaries
Sub-agent
Step 10: Price Analysis
AI sub-agent generates price band heatmaps, elasticity analysis, and gross margin estimates
Sub-agent
Step 1 handles initialization (directory setup, API credential validation). Step 11 generates the final report.
The product research pipeline follows the MECE principle (Mutually Exclusive, Collectively Exhaustive): no step duplicates another's data, and all steps together cover the full TikTok Shop decision chain.
Real Case Study: Bluetooth Earbuds, US Market, $6.6M+
Here is what the system produced when I ran it on February 3, 2026, with these inputs:
Keyword: bluetooth earbuds
Market: US
Key Findings
Market Size:
The top 5 stores in this category had combined estimated GMV exceeding $118M (including a health supplements brand that also sells on TikTok Shop). The bluetooth earbuds-specific GMV was $6.6M+. The weekly sales leader — MINISO MS105 — moved an estimated 7,260 units at $9.99, generating roughly $72K in weekly GMV from a single SKU.
Price Band Analysis:
Price Band
Sales Volume
Competition
Margin
Under $10
Very High
Very High
Low
$10–15
High
High
Low-Medium
$15–20
High
Medium
Medium
$20–30
Medium
Medium-Low
High
$30–50
Low
Low
Very High
The sweet spot was $17.67 — balancing volume against margin. That is exactly where MSHUKCOE positioned its sleep earbuds, pairing a niche use case (sleep-specific design) with a 15% creator commission rate to drive adoption.
Top 3 Bestseller Breakdown:
MINISO MS105 ($9.99) — Pure price play. Four color variants, 90K+ units of the white variant in stock, 619 creators generating content. The strategy: overwhelming value at a psychological price point, subsidized by massive creator volume.
MSHUKCOE Sleep Earbuds ($17.67) — Scene-specific positioning. Targeted the sleep use case that mainstream earbuds underserve. 15% commission rate (above category average) attracted creators despite lower unit volume (3,980/week). Impressions hit 80M+.
MS190 Translation Earbuds ($13.99) — Feature innovation. 134-language translation capability carved out a long-tail niche. Fewer weekly sales but the longest product lifecycle curve in the dataset.
Creator Ecosystem:
Follower Tier
Share of Creators
Collaboration Model
Expected ROI
100K+
4%
Flat fee + commission
1.5x
10K–100K
18%
Commission only (15%)
3x
1K–10K
32%
Commission only (10%)
5x
Under 1K
46%
Free samples
8x
The data showed that mid-tier creators (10K–100K followers) delivered the best ROI for new entrants. They are large enough to drive meaningful volume but small enough to accept commission-only deals.
Review Sentiment:
Positive: 78%
Neutral: 11%
Negative: 11%
The top pain points in negative reviews: "not as expected" (35%), "quality issues" (30%), "connectivity problems" (20%). These pain points are product development signals — if you can solve the gap between marketing promises and actual product experience, you have a differentiation angle.
The Technical Stack: Apify + Claude Code Sub-Agents
Why Apify
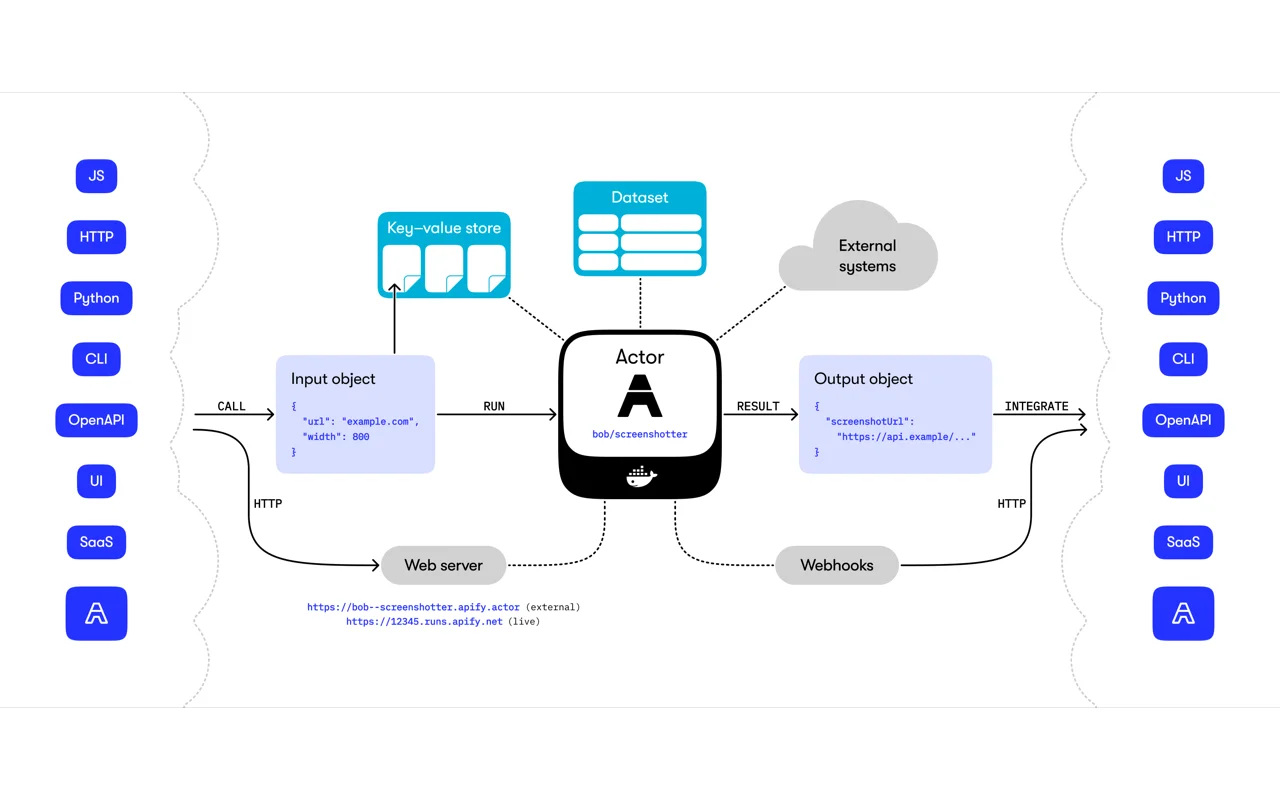
TikTok Shop does not offer a public data API. Getting product, store, creator, and review data requires web scraping infrastructure. Apify is a mature data collection platform (founded 2015) that provides:
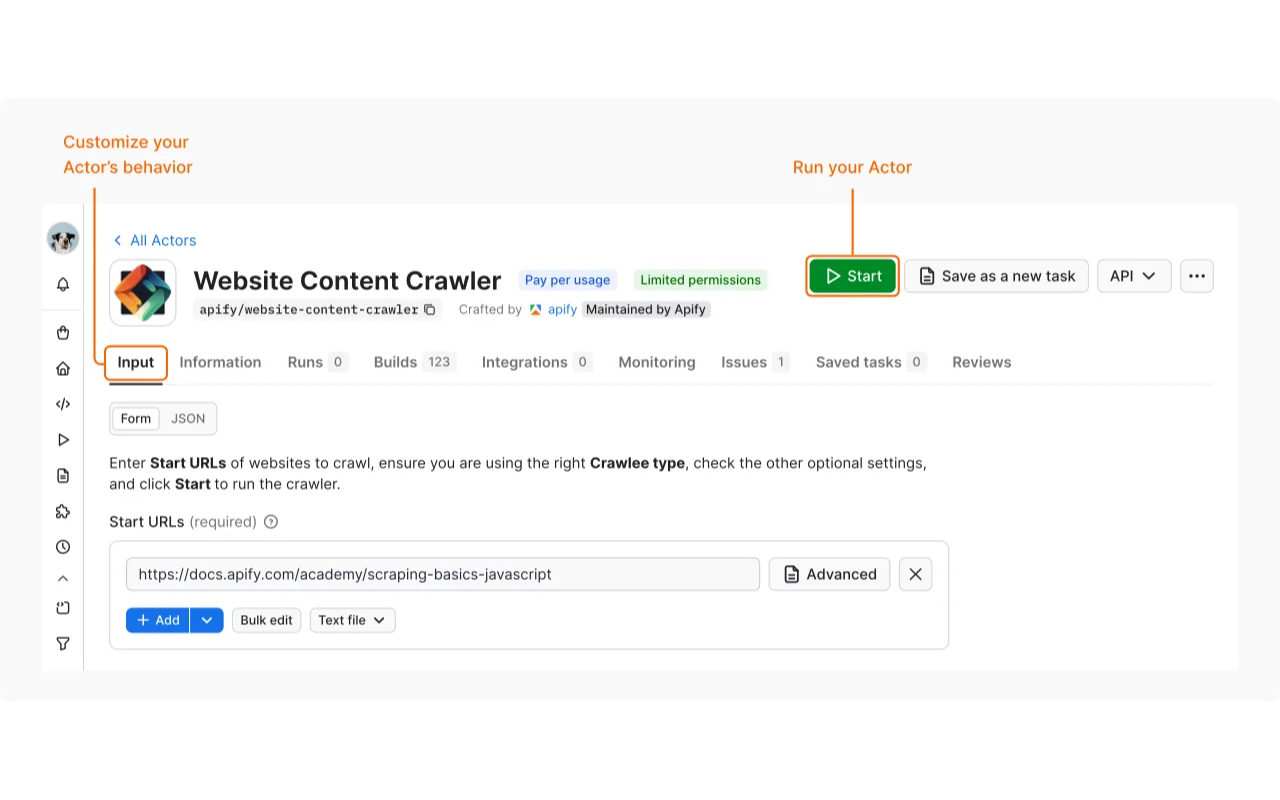
Pre-built Actors — community-maintained scraping templates, ready to use
Pay-per-result pricing — you pay for data, not server time
Compliance layer — actors go through platform review
The six Apify Actors I use:
Step
Actor
Function
Cost
2, 3, 5
pratikdani/tiktok-shop-search-scraper
Product search, bestsellers, store catalog
~$0.005/item
6
novi/tiktok-shop-scraper
Product details (SKU, variants, inventory)
~$0.01/item
7
apidojo/tiktok-profile-scraper
Creator profiles
~$0.30/1000
8
apidojo/tiktok-comments-scraper
Review collection
~$0.10/1000
Total cost per full analysis run: approximately $0.50–$2.00, depending on market size.
Why Sub-Agents
Data collection is mechanical — scripts handle it. But data analysis requires understanding patterns, drawing inferences, and generating actionable insights.
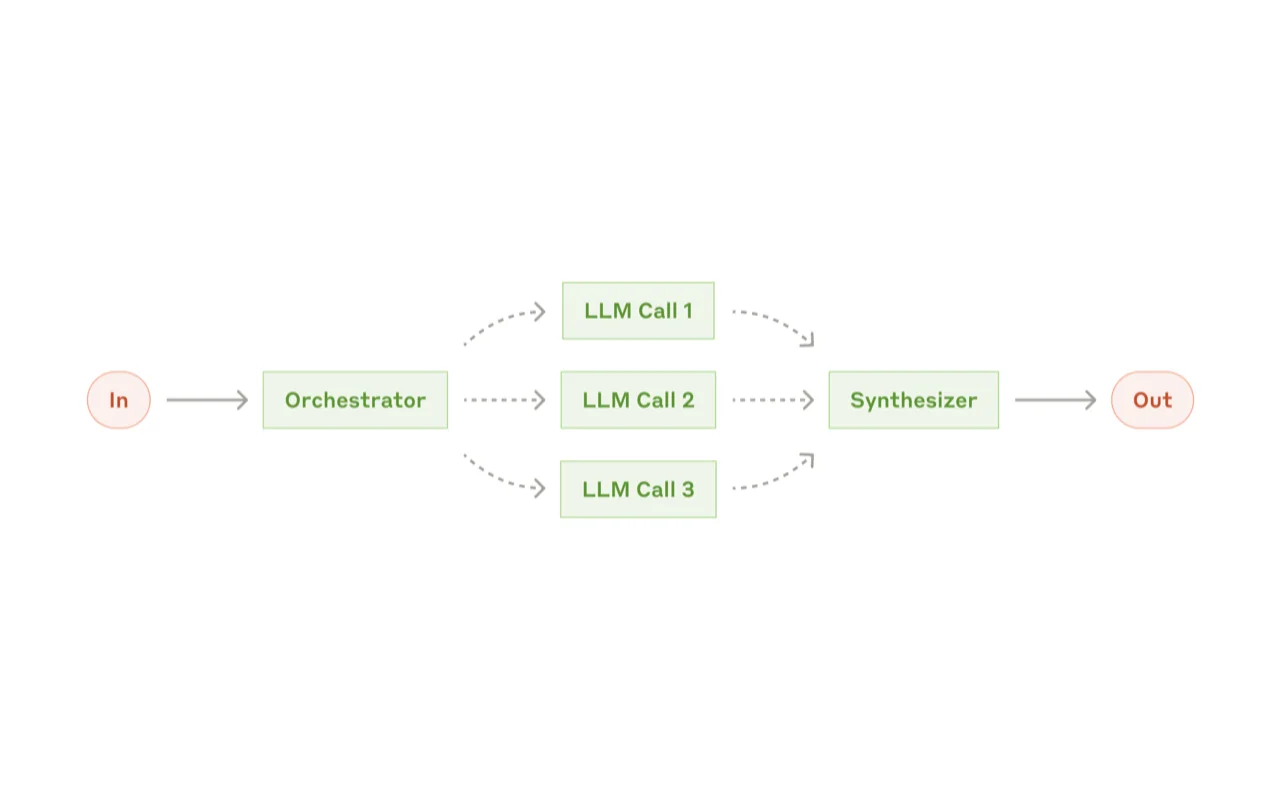
That is where Claude Code's sub-agent architecture comes in. The main agent orchestrates the pipeline and handles data collection. Three sub-agents handle the analytical work:
Sub-Agent 1 (Step 9): Reads all previous summaries and builds a competitive analysis — product strength matrices, store strategy breakdowns
Sub-Agent 3 (Step 11): Synthesizes everything into the final 600-line report
This separation keeps each agent focused. The main agent handles logistics; the sub-agents handle reasoning. Neither tries to do both.
What the Report Actually Looks Like
The output report follows a progressive depth structure inspired by the pyramid principle: each section goes deeper, and readers can stop at whatever level matches their available time.
Section 1: Market Overview (5 Minutes)
The executive summary opens with a one-line market verdict:
"Bluetooth earbuds on TikTok Shop US is a red-ocean market. The $9.99 price-leader strategy works short-term but offers thin margins. JLab's brand-building approach proves that mid-to-premium positioning still has room. Translation earbuds and other feature-differentiated products represent the clearest blue-ocean opportunity."
Then: a 6-metric dashboard (market size, median price, weekly sales leader, positive review rate, peak creator count, commission rate range), three immediate action items, and two highest-priority risks.
Section 2: Deep Analysis (15 Minutes)
Each top-3 bestseller gets a 6-dimension teardown: price strategy, product positioning, core selling points, SKU strategy, creator ecosystem, and impression-to-conversion efficiency.
Store analysis uses a quadrant model (high price/low price × high creator engagement/low creator engagement) and a capability radar (price competitiveness, product quality, brand influence, creator ecosystem, product innovation).
Price analysis includes a heatmap of volume and margin by price band, plus elasticity coefficients showing that sub-$10 products have high price sensitivity (small price changes cause large volume swings) while $27+ products show low elasticity (brand loyalty dominates).
Section 3: Action Guide (10 Minutes)
Three strategies by budget:
Strategy
Budget
Target Price
Monthly Goal
Expected ROI
A: Single SKU Sprint
Under $5K
$9.99
1,000 units
2x
B: Category Matrix
$5K–$20K
Multi-price
5,000 units
3x
C: Brand Building
$20K+
$25–35
$50K+ GMV
5x
Each strategy gets a detailed breakdown: target product type, reference competitors, required features, SKU count, commission settings, supply chain requirements, expected margins, and risk level.
What I Learned Building a TikTok Shop Product Research System
Three lessons from running this system across multiple product categories:
Data does not tell you what to sell. It tells you what not to sell. The most valuable output is not the "opportunity" section — it is the risk analysis. Knowing that the $9.99 price point is saturated with a 619-creator moat saved me from making an expensive mistake.
Automation has a boundary. The system handles the repeatable parts: data collection, aggregation, formatting, pattern detection. But interpreting what the patterns mean for your specific situation — your supply chain, your cash flow, your risk tolerance — that is still your job. The system gives you the map. You decide the route.
Speed changes the game. Before this system, a thorough competitive analysis took me 3 days. Now it takes 3 minutes. But the real value is not the time saved — it is what I do with the extra time. Instead of grinding through spreadsheets, I spend those 3 days on product differentiation, supplier negotiations, and creator relationship building. The things that actually determine whether a product succeeds.
How to Build Your Own TikTok Shop Product Research AI
You need three things: a Claude Code subscription, an Apify account (free tier works for small runs), and the system prompt below.
Copy this prompt into Claude Code to scaffold the entire system from scratch:
You are a TikTok Shop data analysis system architect. Build a complete TikTok Shop product tracking and analysis Skill with the following specifications.
System goal: Input a product keyword, auto-complete 11 data collection and analysis steps, output a 600-line actionable e-commerce analysis report.
Core architecture:
Three-layer aggregation — Raw data (~750KB) → Step summaries (~50KB) → Final report (~20KB)
11-step pipeline — Init → Product search → Bestsellers → Store extraction → Store catalogs → Product details → Creator data → Review data → Competitive analysis (sub-agent) → Price analysis (sub-agent) → Report generation (sub-agent)
Build the complete system following this architecture.
That gives Claude Code enough context to generate the Skill definition, API integration code, and report templates. You will need to add your Apify API key and adjust the report structure to match your specific needs.
Ready-to-Use Prompt: Design a Keyword-to-Market-Report Research Pipeline (3 Layers / 11 Steps)
What this does: Replaces For-You-Page reacting with real research: designs a three-layer data aggregation (products / stores / creators+reviews), an 11-step scrape-to-action pipeline, the 750KB→20KB compression, and the scraper+sub-agent stack — turning one keyword into a full market report that tells you where you can actually compete. Based on: How I Built an AI System That Turns One Keyword Into a Full TikTok Shop Market Report — https://aiworkflowpro.com/tiktok-shop-product-research-ai/ Time to run: ~5 minutes
Copy this prompt into Claude Code, ChatGPT, or any AI assistant:
ROLE: You are an e-commerce market-research pipeline architect. Your job: design a system that turns one keyword into a full market report via three-layer data aggregation and an 11-step pipeline that compresses raw scrape into an actionable report — replacing For-You-Page reacting with real research.

CONTEXT — KEYWORD-TO-MARKET-REPORT PIPELINE (3 LAYERS / 11 STEPS):
Most TikTok Shop sellers get product research wrong — they react to what blows up on their For You Page, then source before analyzing, and enter markets top sellers spent months fortifying. Real research is different: a keyword feeds a three-layer data aggregation (products, stores/sellers, creators/reviews) run as an 11-step pipeline (scrape → aggregate → analyze → score → action plan) that compresses about 750KB of raw data into a ~20KB actionable report in minutes. The stack is a scraper (Apify) for collection plus Claude Code sub-agents for compression and analysis — scraping gathers, AI compresses.

INPUTS (fill in before running):
- KEYWORD: YOUR_PRODUCT_KEYWORD_HERE (the product/market to research)
- MARKET: YOUR_REGION_HERE (US / UK / SEA / other)
- BUDGET_DEPTH: YOUR_STANCE_HERE (quick scan / standard depth / deep)
- ACTION_FOCUS: YOUR_GOAL_HERE (enter the market / find a gap / price a listing)

METHOD — 6 STEPS:

Step 1 — Replace reacting with the research frame
Confirm the shift: you are researching the KEYWORD market, not chasing a For-You-Page trend. Reacting = entering fortified markets; researching = finding where you can actually compete. State the difference for KEYWORD.

Step 2 — Design the three-layer aggregation
Define the three data layers: (1) products + pricing, (2) stores/sellers + their traction, (3) creators + reviews/sentiment. Each layer answers a different question — what sells, who sells it, who promotes it and what buyers say. All three are required; a missing layer is a blind spot.

Step 3 — Build the 11-step pipeline
Lay the 11 steps: scrape products → scrape stores → scrape creators → scrape reviews → scrape pricing → aggregate per product → competitor analysis → market sizing → sentiment extraction → opportunity scoring → action plan. Each step has one input and one output; scraping gathers, analysis compresses.

Step 4 — Set the compression (750KB → 20KB)
Define how raw scrape compresses to an actionable report: structured tables, scores, ranked opportunities, one action plan — not a data dump. The compression is the value; raw scrape is unreadable. Target the ~600-line / 20KB report shape.

Step 5 — Assign the stack (scraper + sub-agents)
Assign: a scraper (Apify) for the three-layer collection, Claude Code sub-agents for the analysis/compression steps. Scraping gathers, AI compresses — do not ask the scraper to analyze or the AI to scrape.

Step 6 — Produce the report + action focus
Against ACTION_FOCUS, structure the report sections (market size, top competitors, pricing band, creator landscape, review sentiment, opportunity score, action plan). Validate: (1) all three layers collected? (2) 11 steps run? (3) compressed not dumped? (4) does it answer ACTION_FOCUS? (5) runnable in ~3 min?

RULES:
- Research, don't react — a For-You-Page trend is not market research; it is entering fortified markets.
- All three layers (products / stores / creators+reviews) are required — a missing layer is a blind spot.
- Scraping gathers, AI compresses — never ask the scraper to analyze or the AI to scrape.
- The report compresses raw data to action; a data dump is not a report.

OUTPUT FORMAT:
Output six sections:
1. **Research frame** — the react-vs-research distinction for KEYWORD.
2. **Three-layer aggregation** — markdown table with columns: Layer | What it answers | Source.
3. **11-step pipeline** — markdown table with columns: Step | Input | Output.
4. **Compression** — how raw → report (target ~600 lines / 20KB), what gets cut vs kept.
5. **Stack assignment** — markdown table with columns: Task | Tool (scraper / sub-agent).
6. **Report structure + validation** — the report sections for ACTION_FOCUS + markdown table with columns: Check | Pass? (Y/N).
Save as @templates/tiktok-shop-product-research-ai.md and run when you research a product market, then re-run for each new keyword or region.
Frequently Asked Questions
Can AI really do product research for TikTok Shop?
Yes — but with a critical caveat. AI handles data collection, pattern recognition, and report generation extremely well. It can scrape thousands of product listings, calculate market metrics, and identify trends that would take a human analyst days to find. What it cannot do is make the final business judgment. The system gives you a comprehensive market map. Whether to enter that market, at what price point, with what product differentiation — those decisions still require human judgment about supply chain capabilities, risk tolerance, and competitive positioning.
How much does it cost to run a full analysis?
Each complete run costs approximately $0.50–$2.00 in Apify API fees, covering product search, bestseller data, store catalogs, product details, creator profiles, and review collection for one keyword in one market. Add the Claude Code subscription cost (~$20/month for Pro, ~$100/month for Max). The marginal cost of additional analyses is just the Apify fees — you can run as many as you need.
What data points should a product research system cover?
Five dimensions matter for TikTok Shop: (1) product metrics — sales volume, ratings, SKU variants, inventory levels; (2) store intelligence — product mix, estimated GMV, market positioning; (3) creator analytics — follower tier distribution, collaboration efficiency, ROI by tier; (4) review sentiment — satisfaction/dissatisfaction ratio, specific pain point categories and frequencies; (5) pricing landscape — price band distribution, volume-margin tradeoffs, elasticity estimates.
Do I need coding skills to use this?
You need basic comfort with a command-line terminal — enough to open it, paste a prompt, and press Enter. Claude Code handles all the scripting, API calls, data processing, and report generation. You do not need to write Python, understand JSON, or configure API endpoints. Your job is to provide the keyword, read the output, and make the business decision.
Is this approach better than using Kalodata, Shoplus, or EchoTik?
Different tools for different purposes. Paid analytics platforms like Kalodata ($60–$200/month) give you a polished dashboard with ongoing monitoring. This system gives you a deep, one-time analysis at a fraction of the cost — and you own the data and the methodology. If you need daily monitoring, use a platform. If you need a thorough market entry analysis before committing capital, build a custom pipeline. Many sellers use both.
Monitoring a competitor who publishes no feed is the case every RSS guide skips. Twenty-one platforms sorted by which of three jobs they do, and the finished setup is business process automation you own outright, with no seat licence to renew.
Blaming the content is the reflex when a post underperforms, and it is usually the wrong diagnosis. A second reader decides distribution before any human sees the post, and most of what it checks is mechanical enough to automate business processes around, on five platforms at once.
Thursday afternoon, fourteen product ideas, a Monday filming slot, no scripts. Six script shapes and seven hook formulas turn that hour into finished drafts — and the business rule stays: rewrite at least 30% before anything ships.
A detector score cannot survive a conversation with the freelancer it just cost three weeks of payment. What holds up is the specific thing on the page: rhythm, vocabulary, missing detail. Eight of them here, and the reason review stays human when you automate business processes.