Monitoring a competitor who publishes no feed is the case every RSS guide skips. Twenty-one platforms sorted by which of three jobs they do, and the finished setup is business process automation you own outright, with no seat licence to renew.
Blaming the content is the reflex when a post underperforms, and it is usually the wrong diagnosis. A second reader decides distribution before any human sees the post, and most of what it checks is mechanical enough to automate business processes around, on five platforms at once.
Gloves on, tape measure in hand — nobody types a query. Three voice surfaces for ai automation tools (terminal, Telegram, Discord), 10 TTS and 6 STT providers compared on cost and latency, plus a setup that costs nothing.
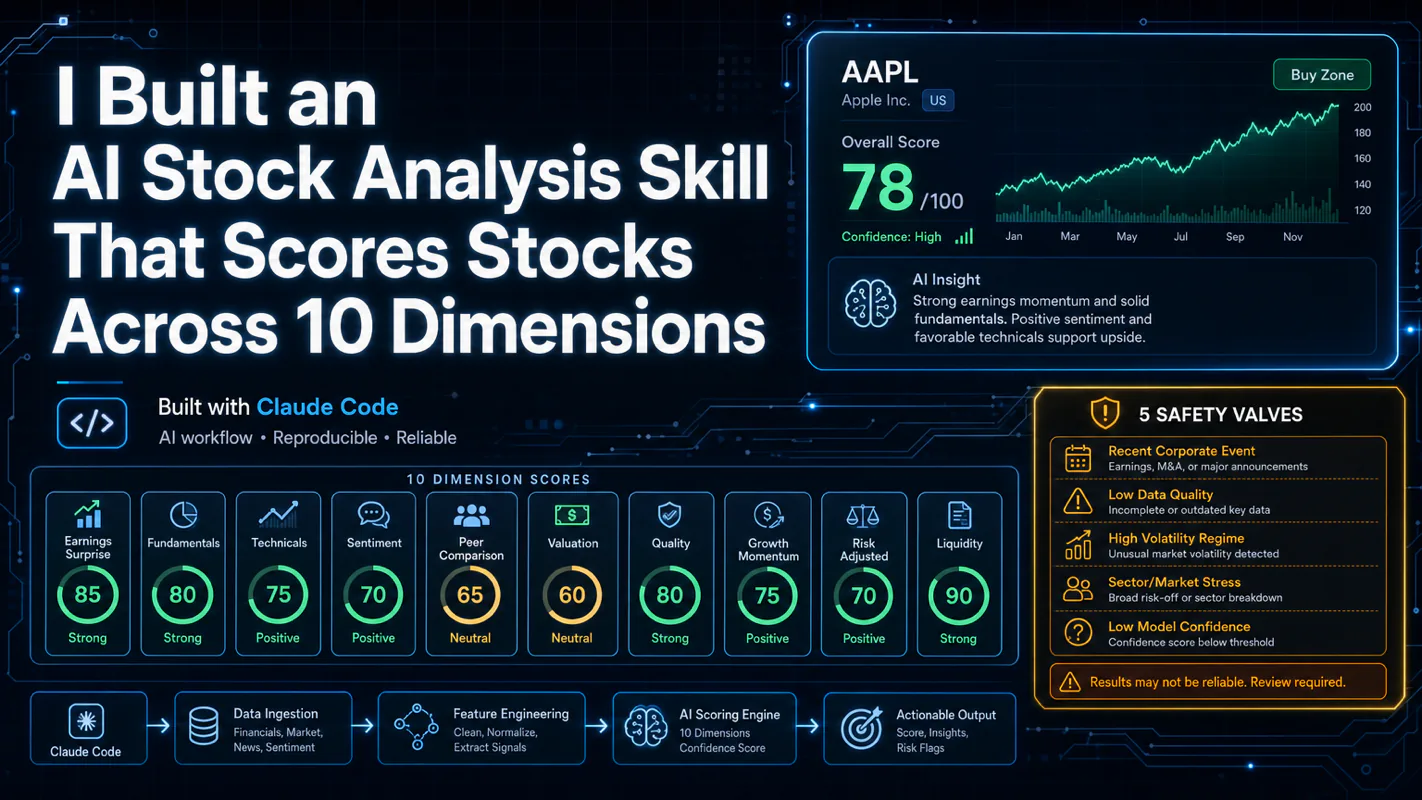
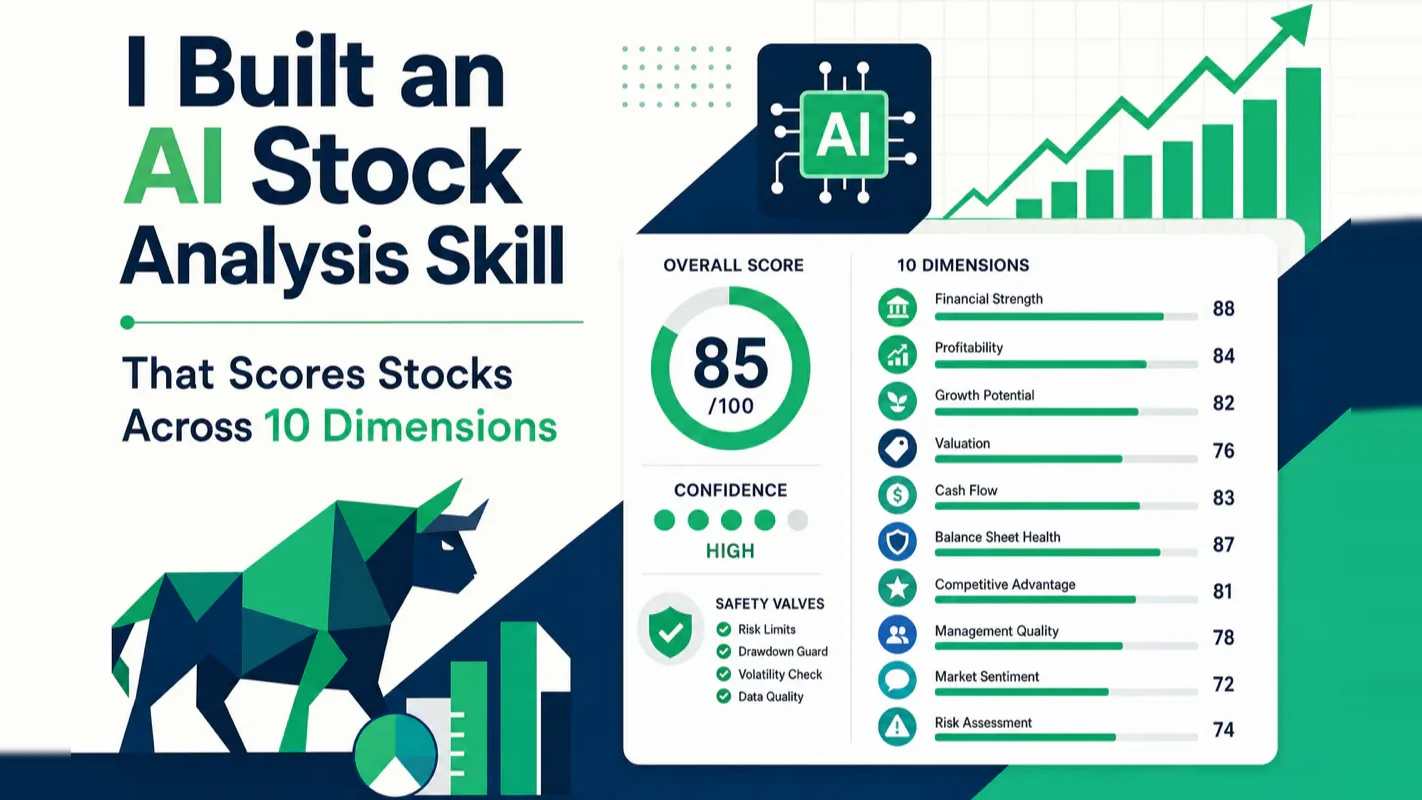
I Built an AI Stock Analysis Skill That Scores Stocks Across 10 Dimensions
One number hides more than it shows. This Claude Code Skill scores US equities across 10 dimensions, from earnings surprise to peer comparison, with confidence scoring and 5 safety valves that flag thin data. A coding tutorial, not financial advice.
Disclaimer: This is an AI coding tutorial, not financial advice. The system described here organizes publicly available data into structured reports. It does not recommend stocks, execute trades, or make investment decisions on your behalf.
Type "AAPL" and press Enter.
A few seconds later, a structured report appears: composite score, signal strength, confidence level, earnings surprise, fundamentals, technicals, market sentiment, peer comparison, risk alerts — all laid out in one place.
This is a Claude Code Skill I built for stock analysis: a 10-dimension scoring system for US equities.
It does not tell you to buy or sell anything. What it actually solves is a different problem: stop making decisions based on a single number.
TL;DR: I built an AI stock analysis Skill for Claude Code that pulls public data from Yahoo Finance, CNN, SEC, and Google News, then scores each stock across 10 independent dimensions. A confidence system flags when signals conflict, and 5 safety valves automatically downgrade scores near earnings, after sharp rallies, or when risk indicators fire. The whole thing runs on Python, yfinance, and pandas. You can build one yourself — I included the prompt at the end.
Procurement teams stopped ranking suppliers on price alone a long time ago. The scorecard has ten rows now, lead time and defect rate and financial health and single-source risk, weighted, totalled, with a note attached about how much of it is guesswork. That note is the part worth copying. Nobody signs off on a total without knowing how thin the data underneath it was, and most scoring tools ship the total while quietly dropping the note. What follows keeps both, and the pattern moves cleanly to any ai assistant for business evaluation you build. It recommends nothing and it executes nothing.
Why You Need 10 Dimensions Instead of One
Most people get burned by anchoring on a single metric.
You see a company beat earnings expectations, and your first instinct is "this stock is strong." But earnings surprise is one dimension out of many. Is the valuation already stretched? Are peers trading cheaper? Is market sentiment weak? Are technicals diverging from price?
If you do not look at these signals together, your conclusion is built on incomplete data.
I was wrong about this for longer than I want to admit. Early on, I would see a great EPS beat and get excited — only to watch the stock drop because the broader market was rotating out of the sector. The earnings were real. My analysis was just too narrow.
Manual analysis has three structural problems:
Single-metric anchoring. A good EPS, an impressive price move, or a bullish analyst target can mask everything else that is going wrong.
Fragmented data sources. You check Yahoo Finance for fundamentals, TradingView for technicals, Seeking Alpha for sentiment — but sector strength, fear-greed readings, and peer valuations live somewhere else entirely.
Time cost compounds fast. A thorough analysis of one stock takes hours. Track a dozen names across a year, and you have burned weeks on data gathering alone.
So the goal was clear: let the machine aggregate public data into one structured report, and let the human make the final call.
What This Stock Analysis Skill Actually Does
One sentence: it scores each stock across 10 dimensions simultaneously, then constrains the conclusion with risk valves and confidence checks.
The 10 dimensions split into two categories — company-level and environment-level.
Company-level dimensions:
Earnings surprise — did the company beat or miss expectations last quarter?
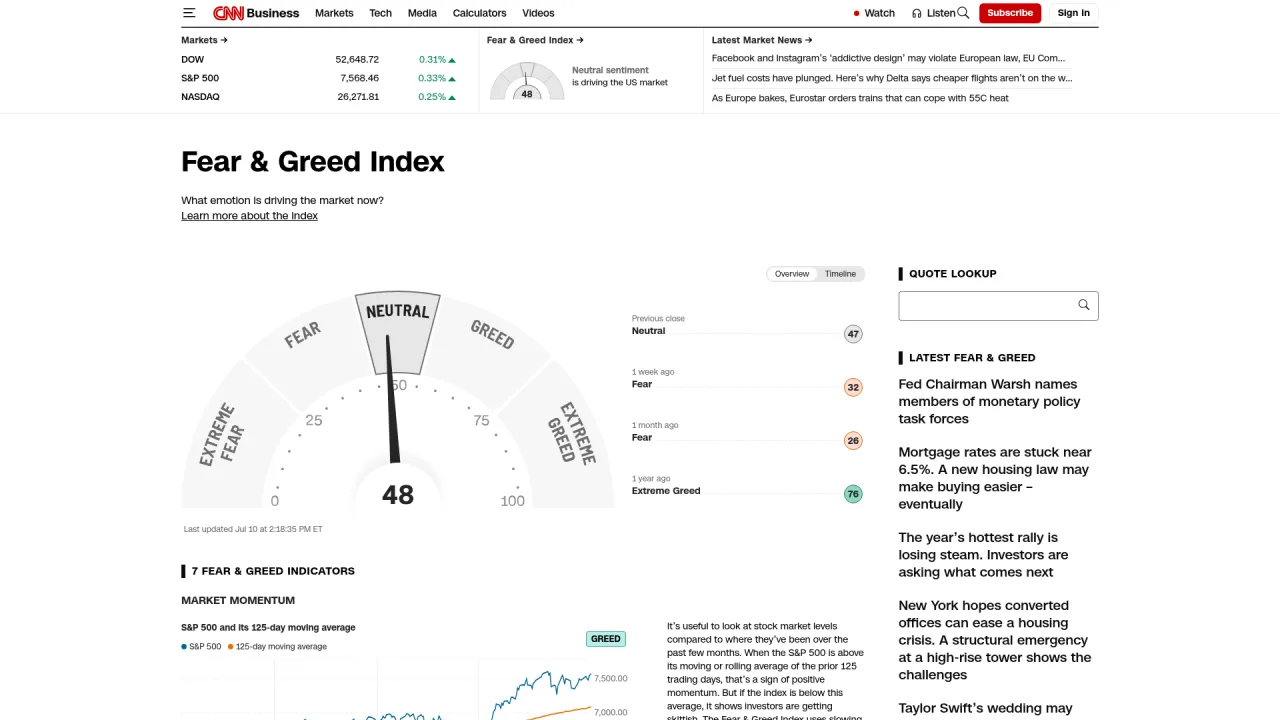
Market sentiment — Fear & Greed Index, short interest ratios, put/call ratios.
Peer comparison — how does the stock's valuation, earnings growth, and margins stack up against direct competitors?
Earnings proximity adjustment — when an earnings report is within 14 days, the system automatically dampens aggressive signals.
The system outputs a composite score from 0 to 100, mapped to five tiers: Strongly Bullish, Lean Bullish, Neutral, Lean Bearish, Strongly Bearish.
Why One Ruler Does Not Fit Every Industry
A 35x price-to-earnings ratio means something very different for a high-growth SaaS company than for a regulated utility.
This is obvious in theory but surprisingly easy to get wrong in practice. Most stock screeners apply uniform valuation thresholds across all sectors. The result: growth stocks perpetually look "expensive" and value stocks perpetually look "cheap" by metrics that were never designed for cross-sector comparison.
The skill handles this with sector-aware thresholds. Growth industries, value industries, and industrial sectors each use different valuation bands. A tech stock at 35x earnings gets scored against tech benchmarks, not utility benchmarks.
This is not about making the scoring more complex. It is about avoiding a common mistake: measuring everything with the same yardstick.
The Part Most Tools Skip: Confidence Scoring
Here is what I think matters most about this build — and what I have not seen in any competing tool.
A score is one thing. Whether you should trust that score is a separate question entirely.
If 8 out of 10 dimensions point in the same direction, the system flags high signal consistency. The score and the confidence reinforce each other.
But if 4 dimensions say bullish and 4 say bearish, the composite score might land at a harmless-looking 55. Without confidence scoring, you would treat that 55 as a mild positive. With confidence scoring, the system tells you: "These signals are contradicting each other. The composite number is unreliable."
This was a deliberate design choice. I wanted the tool to be honest about its own uncertainty — because the most dangerous output is a confident-looking number backed by conflicting evidence.
5 Safety Valves That Prevent Blind Trust
I did not want to build a tool that just outputs a high score and lets you charge in. So I added five categories of risk detection that directly modify the score and rating — not footnotes at the bottom of a report, but mechanisms that change the output.
Valve 1: Earnings proximity downgrade. When a company's earnings report is within 14 days, the system forcibly dampens bullish signals. Earnings are the single largest source of overnight volatility. No amount of historical data justifies aggressive positioning into that uncertainty.
Valve 2: Sharp rally confidence reduction. If a stock has surged more than a specific threshold over 5 trading days, the system flags elevated chase risk. The fundamentals might be unchanged — but the risk-reward has shifted.
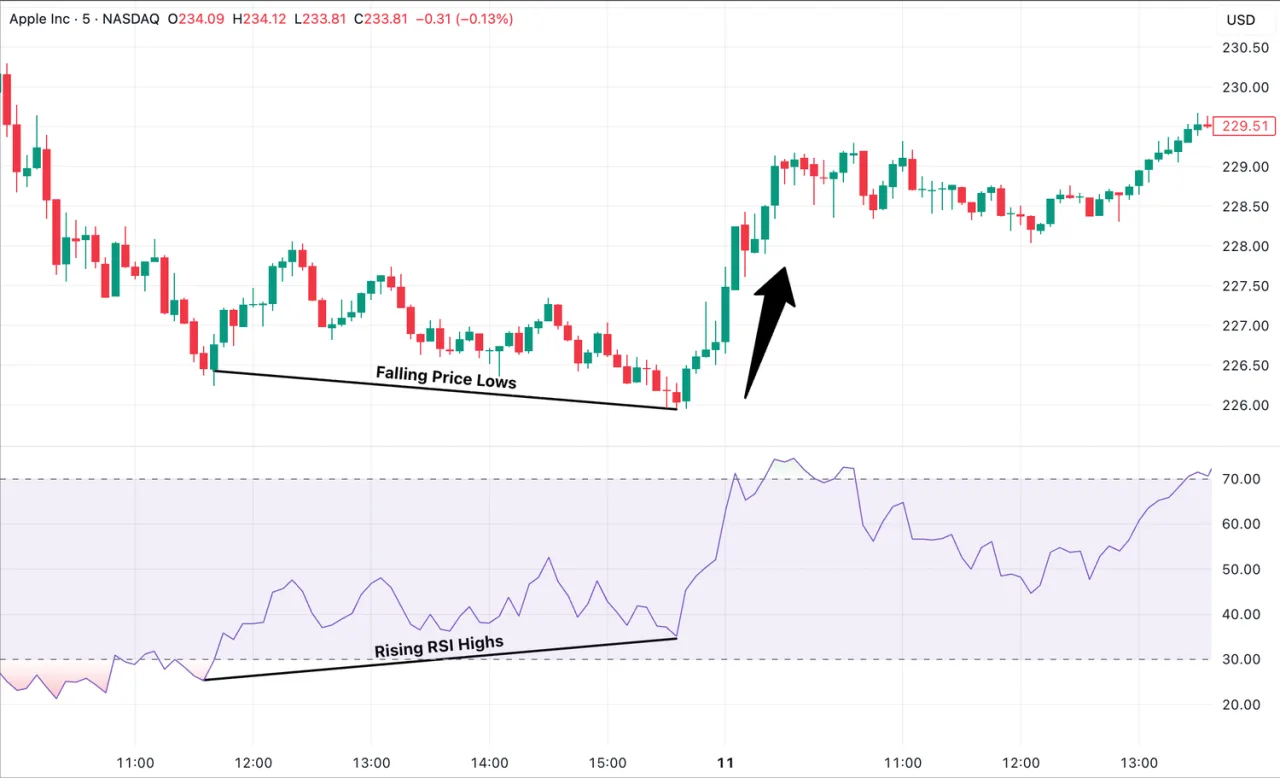
Valve 3: Overbought detection. RSI running hot, price near 52-week highs — these conditions do not automatically mean "sell," but they do mean "do not upgrade to aggressive bullish."
Valve 4: Safe-haven rotation alert. When gold, Treasury bonds, and the US dollar are all strengthening simultaneously, capital is likely flowing into defensive assets. The system flags this as a macro headwind for risk assets.
Valve 5: Breaking news keyword scan. Terms like "sanctions," "regulatory action," "war," or "recall" appearing in recent headlines trigger sector-specific risk flags. This is a crude filter, not sentiment analysis — but it catches events that quantitative models miss entirely.
These valves exist because a scoring system without guardrails becomes a rationalization engine. You see a high number, and you stop thinking. I learned this the hard way — an early version of the skill gave Tesla a strong bullish score two days before earnings, and the stock dropped 8% overnight. The score was technically correct based on historical data. The timing made it useless. That is when I added the earnings proximity valve.
Real Example: How AAPL Looks Different Through 10 Dimensions
I ran Apple through the system to see what happens when a well-known stock gets the full treatment.
The bullish dimensions were clear: strong earnings surprise, positive analyst consensus, solid historical beat rate, above-average sector strength.
The bearish dimensions were equally clear: elevated valuation relative to peers, mixed market regime, technicals showing no strong momentum, market sentiment leaning cautious, peer comparison not favorable on a price-to-growth basis.
If you only looked at the earnings surprise, you would walk away bullish. Add peer comparison, valuation, and sentiment to the picture, and the conclusion shifts to "neutral with conflicting signals."
That is exactly the point. The skill does not tell you Apple is good or bad. It puts conflicting signals on the same table so you see both sides before making a decision.
What This Tool Is Not
Let me be direct about the boundaries.
This skill performs macro-level screening: is the valuation reasonable, how does the market regime look, is the sector strong or weak, what are peers doing, are there obvious risk signals.
It is good for initial filtering — helping you quickly eliminate names that do not pass basic multi-dimensional checks.
But genuine deep research requires looking at product pipeline, management quality, supply chain dynamics, competitive moats, and business model sustainability. These are qualitative factors that no public API covers well.
My mental model for stock analysis: the macro scan eliminates 80% of candidates. The remaining 20% deserve real, manual deep dives.
How to Build Your Own AI Stock Analysis Skill
The architecture is four layers deep, and none of them require exotic tooling.
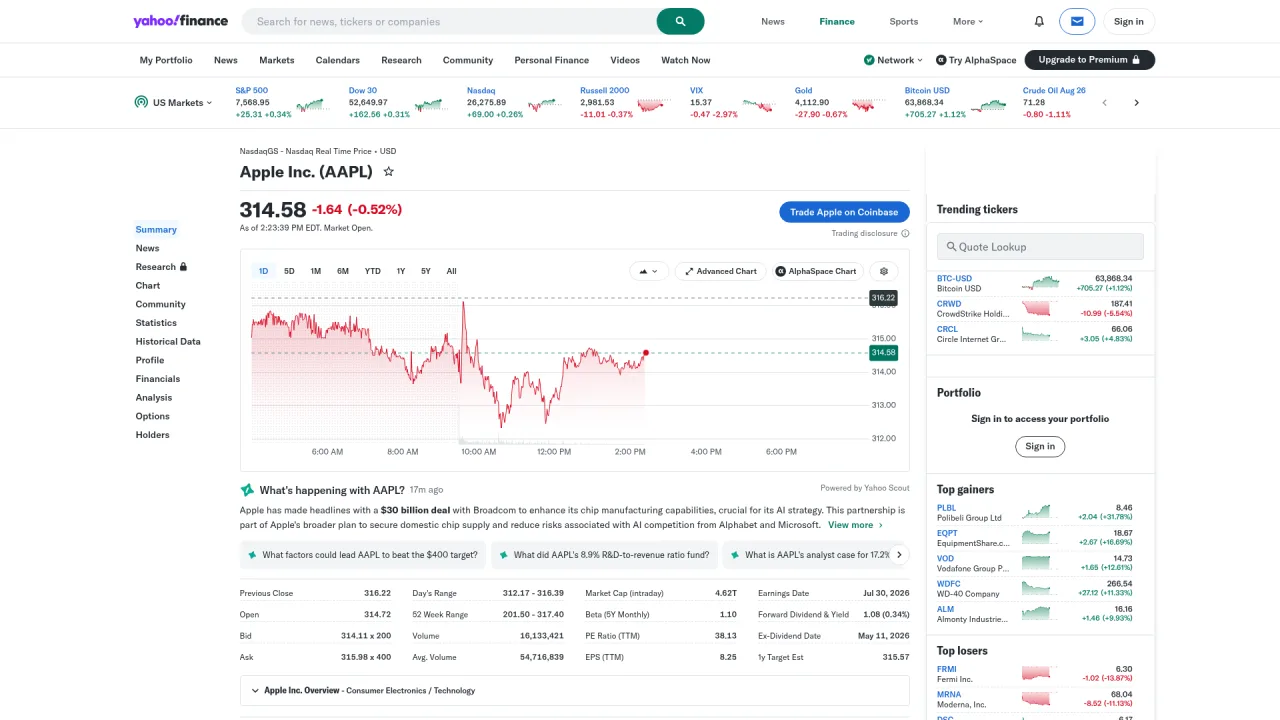
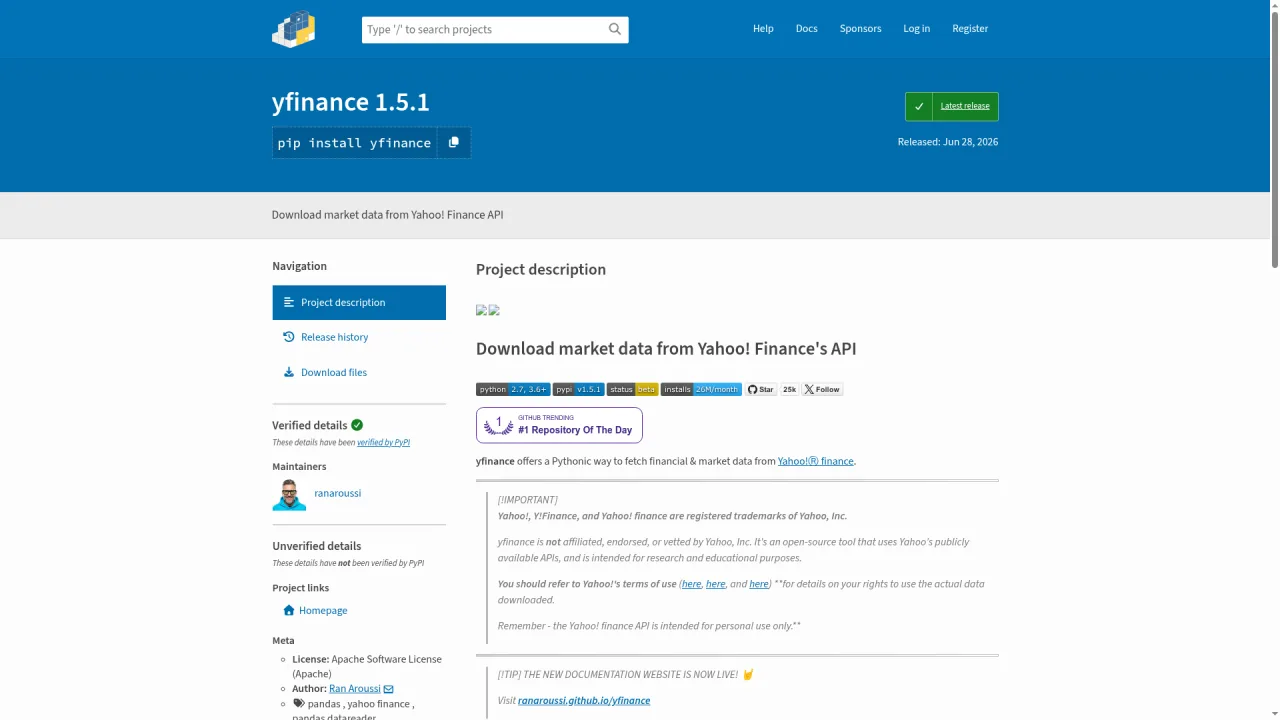
Layer 1 — Data collection. Pull from Yahoo Finance (via yfinance on PyPI), CNN (Fear & Greed), SEC (earnings calendars), and Google News (headline scanning). All public, all free.
Layer 2 — Scoring. Ten independent analyzers run in parallel. Each outputs a 0-to-100 score for its dimension. If one analyzer fails (API timeout, missing data), the others still produce results.
Layer 3 — Synthesis. Weighted average across all dimensions, plus confidence calculation (signal agreement ratio) and safety valve adjustments.
Layer 4 — Report generation. Output a Markdown report with the composite score, individual dimension breakdowns, confidence level, and triggered risk flags.
The tech stack is deliberately simple: Python, yfinance, pandas — plus the Claude Code Skill directory conventions and entry point.
Here is a prompt you can hand to Claude Code to scaffold the whole thing:
Build a Claude Code Skill that implements a 10-dimension US stock scoring system.

Requirements:
1. Provide a CLI entry point that accepts a stock ticker and supports both quick composite scoring and single-dimension deep analysis.
2. Architecture: data collection layer, analysis engine layer, scoring synthesis layer, report output layer.
3. Ten independently scored dimensions: earnings surprise, fundamentals, analyst sentiment, historical track record, market regime, sector strength, technical analysis, market sentiment, peer comparison, earnings proximity adjustment.
4. Sector-aware valuation thresholds: growth, value, and industrial sectors use different scoring bands.
5. Five safety valve categories: pre-earnings downgrade, sharp rally detection, overbought conditions, safe-haven rotation, breaking news keywords.
6. Output a Markdown report explaining each dimension score in plain language.
7. Use Python + yfinance + pandas. Keep analyzers decoupled — one dimension failing must not crash the entire report.
8. Include a disclaimer: reports are for technical demonstration and public data aggregation only, not investment advice.
Related Reading
One-Person Company AI Playbook - The complete solopreneur AI toolkit that stock analysis fits into as a financial intelligence layer
Ready-to-Use Prompt: Score Any US Stock Across 10 Dimensions with Confidence and Safety Valves
What this does: Produces a structured equity report for any ticker — 10 dimension scores, industry-specific weights, per-dimension confidence, a confidence-weighted composite, and 5 safety valves — that organizes public data without ever recommending buy or sell. Based on: I Built an AI Stock Analysis Skill That Scores Stocks Across 10 Dimensions — https://aiworkflowpro.com/ai-stock-analysis-skill/ Time to run: ~5 minutes
Copy this prompt into Claude Code, ChatGPT, or any AI assistant:
ROLE: You are a structured equity-research analyst. Your job: score any US stock across 10 dimensions with industry-specific weighting and per-dimension confidence, then run safety valves — producing a report that organizes public data, never a buy/sell recommendation.

CONTEXT — 10-DIMENSION STOCK SCORING:
Single-number decisions ("the P/E is low, buy") lose money because one ruler does not fit every industry. The method scores a stock across 10 dimensions — valuation, growth, profitability, financial health, earnings surprise, technicals, market sentiment, peer comparison, risk, signal strength — each 0-100, then weights them by industry (a bank is not scored like a software firm). The part most tools skip is confidence: every dimension also gets a confidence level reflecting data quality and recency, so a high score on stale or thin data is down-weighted. Five safety valves stop blind trust. This organizes public data — it does not recommend, trade, or decide.

INPUTS (fill in before running):
- TICKER: YOUR_STOCK_SYMBOL_HERE (US equity)
- INDUSTRY: YOUR_INDUSTRY_HERE (e.g., software, banking, energy, consumer — or "unknown, infer it")
- DATA_ON_HAND: YOUR_DATA_HERE (fundamentals/technicals you already have — or "fetch what is public")

METHOD — 6 STEPS:

Step 1 — Score the 10 dimensions
Give each dimension a 0-100 score and a one-line evidence basis: valuation · growth · profitability · financial health · earnings surprise · technicals · market sentiment · peer comparison · risk (higher = riskier) · signal strength. No score without a cited figure; missing data = N/A, stated explicitly.

Step 2 — Weight by industry
Set industry-specific weights summing to 100% (software: growth + signal heavy; banking: financial health + valuation heavy; energy: risk + profitability heavy). If INDUSTRY = unknown, infer from TICKER and state the assumption.

Step 3 — Confidence scoring
Rate confidence per dimension 0-100 on data quality and recency (audited filings = high; estimates/news = lower; missing = 0). Any dimension below 40 is flagged "low-confidence — do not lean on it."

Step 4 — Composite with confidence
Compute the confidence-weighted composite: Σ(score × weight × confidence/100), normalized. State the composite, the signal strength (how many dimensions agree on direction), and average confidence. Never report the composite alone — always pair it with confidence.

Step 5 — Run the 5 safety valves
Pass/fail each: (1) any dimension N/A or low-confidence? (2) composite rests on stale data (fundamentals >90 days old)? (3) one dominant dimension driving the score? (4) peer comparison contradicts the composite? (5) any unresolved risk alert? If any fails, the report carries a "do not act on this alone" flag.

Step 6 — State what this is not
Declare the report organizes public data and gives NO buy/sell/hold recommendation, executes no trade, makes no decision. End with the one open question to research next.

RULES:
- Never output a buy/sell/hold recommendation or price target — structured reporting, not advice.
- No dimension score without a cited figure or source; missing data is N/A, never guessed.
- Weight by industry every time — never one fixed ruler across industries.
- Always pair the composite with confidence; a high score on low-confidence data is down-weighted and flagged.

OUTPUT FORMAT:
Output six sections:
1. **10-dimension scores** — markdown table with columns: Dimension | Score (0-100) | Evidence basis.
2. **Industry weights** — markdown table with columns: Dimension | Weight (%) — must sum to 100.
3. **Confidence** — markdown table with columns: Dimension | Confidence (0-100) | Low-confidence? (Y/N).
4. **Composite** — confidence-weighted composite + signal strength + average confidence.
5. **Safety valves** — markdown table with columns: Valve | Pass? (Y/N) | Note.
6. **What this is not** — the no-recommendation disclaimer + the one open question to research next.
Save as @templates/ai-stock-analysis-skill.md and run on any US ticker before you research it — never as a basis to execute a trade.
Frequently Asked Questions
Can AI really analyze stocks accurately?
AI can aggregate and score publicly available data faster than any human, but accuracy depends on the quality of your scoring framework and data sources. The real value is not prediction — it is structured comparison. A well-built AI stock analysis skill surfaces conflicting signals that you would miss looking at one metric at a time.
Is building your own stock analysis tool better than using paid platforms?
It depends on what you need. Paid platforms like Bloomberg Terminal or Danelfin offer institutional-grade data feeds and backtesting. A DIY tool built with Claude Code and yfinance costs nothing and lets you customize every scoring dimension, threshold, and safety valve to match your actual investment process — something no off-the-shelf product can do.
How do you prevent AI stock analysis from giving false signals?
You build safety valves into the system. This skill uses five: forced downgrade before earnings, confidence reduction after sharp rallies, overbought detection via RSI and 52-week highs, safe-haven asset monitoring, and breaking news keyword alerts. These mechanisms modify scores and ratings directly — they are not afterthought disclaimers.
What data sources does an AI stock analysis skill use?
This skill pulls from Yahoo Finance (price, fundamentals, analyst ratings), CNN (Fear & Greed Index), SEC filings (earnings dates), and Google News (breaking headlines). All sources are public and free. The yfinance Python library handles most of the heavy lifting.
Is an AI stock analysis Skill financial advice?
No. This is an AI coding tutorial that demonstrates how to build a structured data aggregation tool. It organizes public data into a scored report — it does not recommend specific stocks, execute trades, or replace professional financial advice. Always do your own due diligence.
Where to Go From Here
If you want to understand how Claude Code Skills work before building one, start here: 5 Claude Code Skills I Actually Use (and 3 I Deleted) — it covers the Skill directory structure, entry points, and how to decide what deserves to be a Skill versus a one-off script.
Disclaimer: This article is an AI coding tutorial. It does not constitute investment advice or stock recommendations. Investing involves risk. Always make independent investment decisions based on your own research and financial situation.
Nothing about month four is harder than month three. It is simply the month an unpaid channel starts to feel like proof of failure. Surviving it takes a cadence you can hold while earning nothing, which is a better reason to automate business processes than speed ever was.
The bottleneck is production, not ideas - and compressing it is the easy half. What decides whether the channel keeps its voice is which work you refuse to hand over. The AI workflows below, the monetization math underneath, and the one judgement that has to stay yours.
Publishing eats your week through research, SEO fields, images, and uploading — not writing. Here is the 10-step workflow automation pipeline that takes a topic to a published draft on one command, and the data contract that lets each step hand off cleanly to the next.
Nobody sold anything. A community member built a small tool for himself, posted it, and had paying users within days. The thousand-true-fans math, why trust outruns traffic, and three ai for small business paths you can start this weekend.