A 30-minute video is too long for one conversation. This guide walks the 8-step Skill that locks the narration and one look, then gives each 3-minute segment to a fresh sub-agent, five at a time, and polishes the cut in an empty-context session.
The folder structure behind my AI agent team, the Herdr setup where Grok Build, Claude Code and Kimi Code work side by side, and the two live tasks from the video: an article published by voice and a three-model front-end test.
Eight folders of plain Markdown, a CLAUDE.md index in each, and seven prompts that make your agent interview you. Every prompt, template and command from the video, in order.
The Stanford 457-Page AI Report: 8 Numbers That Change Everything
Three people asked the same question this quarter; the answer changed each time, because the numbers underneath kept moving. Stanford's 457-page index holds eight of them: inference 280x cheaper in 18 months, adoption at 78%, incidents up 56%. Read them before you budget for AI for business.
The same question came at me three times this quarter, from a bookkeeper, a studio owner, and someone running a two-person agency: has this gotten cheap enough to be worth the trouble yet? Each time the honest answer was different, and not because I changed my mind. Running a capable model cost twenty dollars per million tokens in late 2022 and seven cents by late 2024. A question whose answer moves 280-fold in eighteen months is not one you settle once. The eight numbers below are what an argument about AI for business should actually be conducted with.
A friend asked me last week: "Is the Stanford AI Index 2025 actually worth reading, or can I just skim the headlines?"
Short answer: the headlines will mislead you. The Stanford HAI team dropped a 457-page report with 8 chapters and 20+ data sources — and the popular coverage cherry-picked the three or four most clickable numbers. The real story only shows up when you sit with eight specific findings together.
Here are those eight numbers side by side, 18 months ago vs. now:
18 months ago
Today
Cost to run GPT-3.5-level inference
$20.00 per million tokens
$0.07 per million tokens (280× cheaper)
Gap between open-source and closed-source
8%
1.7%
AI coding benchmark (SWE-bench)
4.4%
71.7%
Organizations using AI
55%
78%
US-China gap on MMLU benchmark
17.5 pp
0.3 pp
Reported AI incidents/year
~150
233 (+56.4%)
Top-1 vs top-10 model gap
11.9%
5.4%
US private AI investment
—
$109.1B (12× China)
Those eight numbers from Stanford's AI Index 2025 are the story of AI in 2024-2025. All of them point the same direction: the barrier to using AI is disappearing, and the barrier to doing it responsibly is not keeping up.
I spent about six hours reading the full Stanford report and a week sitting with what it implies for my own one-person content business. What follows is the Q&A I wish I'd had when I started — eight questions, one for each number, answered in plain English with the implication for anyone running on AI tools in 2026. For the complementary forward-looking view, pair this post with MIT's 5 AI Trends for 2026. Stanford gives you the state of the field; MIT gives you the vector.
Q1 — Is AI Actually Getting Cheaper?
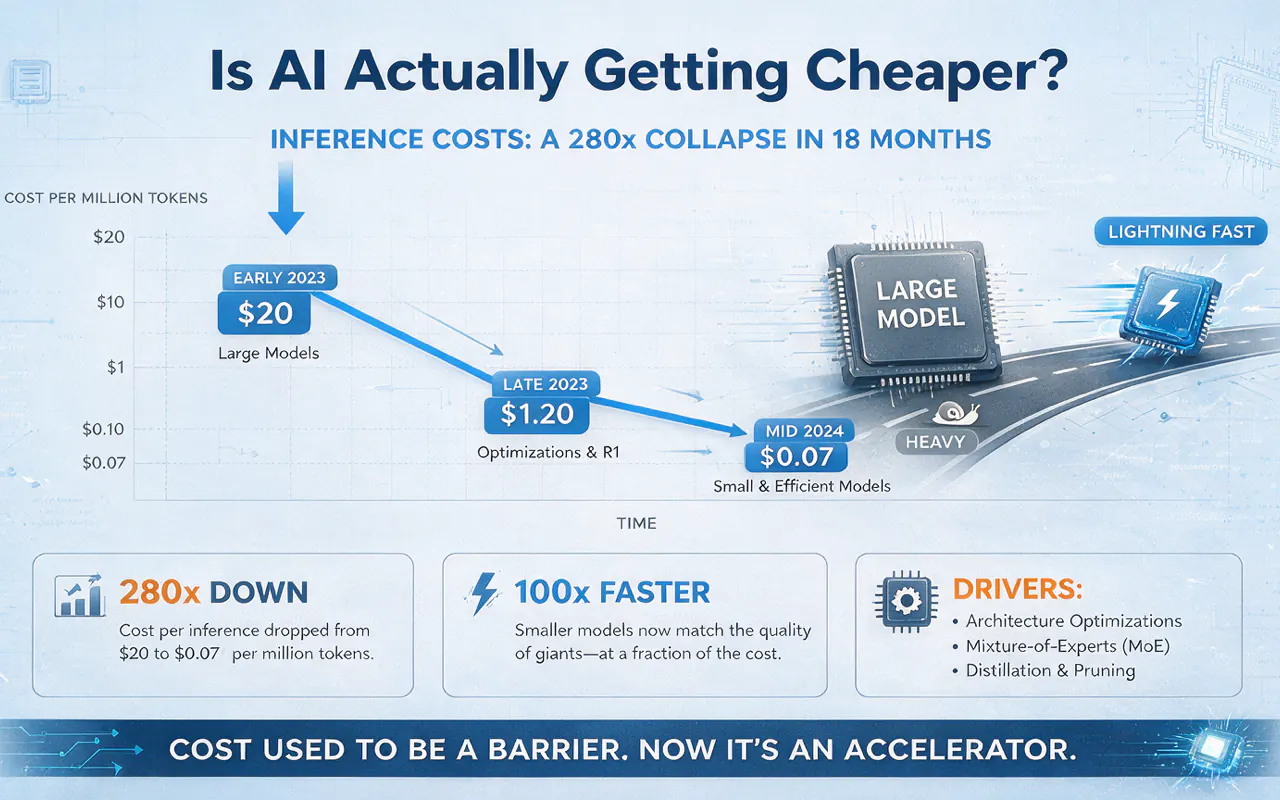
The single most important number in the entire report: inference cost fell 280× in 18 months. Running a GPT-3.5-class model in November 2022 cost $20 per million tokens. By October 2024, it cost 7 cents.
What's happening underneath that curve is two trends compounding:
Efficient models are catching up on quality. In 2022, to score 60% on the MMLU benchmark you needed something like Google's 540-billion-parameter PaLM. In 2024, Microsoft's Phi-3-mini hit the same benchmark with 3.8 billion parameters. That's 142× smaller for equivalent capability.
Hardware is improving on three axes. ML chip performance grows ~43% annually; price-performance improves ~30% annually; energy efficiency improves ~40% annually. Three lines, all favorable, all compounding.
What this means for a solopreneur: the cost to embed AI into your workflow is falling faster than your learning curve. An application you couldn't afford to build 18 months ago is affordable today. Don't assume last year's cost model still holds — re-evaluate quarterly.
The catch: training frontier models is getting more expensive, not less. GPT-4 training cost about $79M. Llama 3.1 405B cost Meta around $170M. One Llama 3.1 training run emits ~8,930 tons of CO₂ — roughly 496 Americans' annual carbon output.
The building cost is going up. The using cost is going down. You want to be on the "using" side of that equation.
Q2 — Has Open Source Caught Up to Closed Source?
Almost entirely.
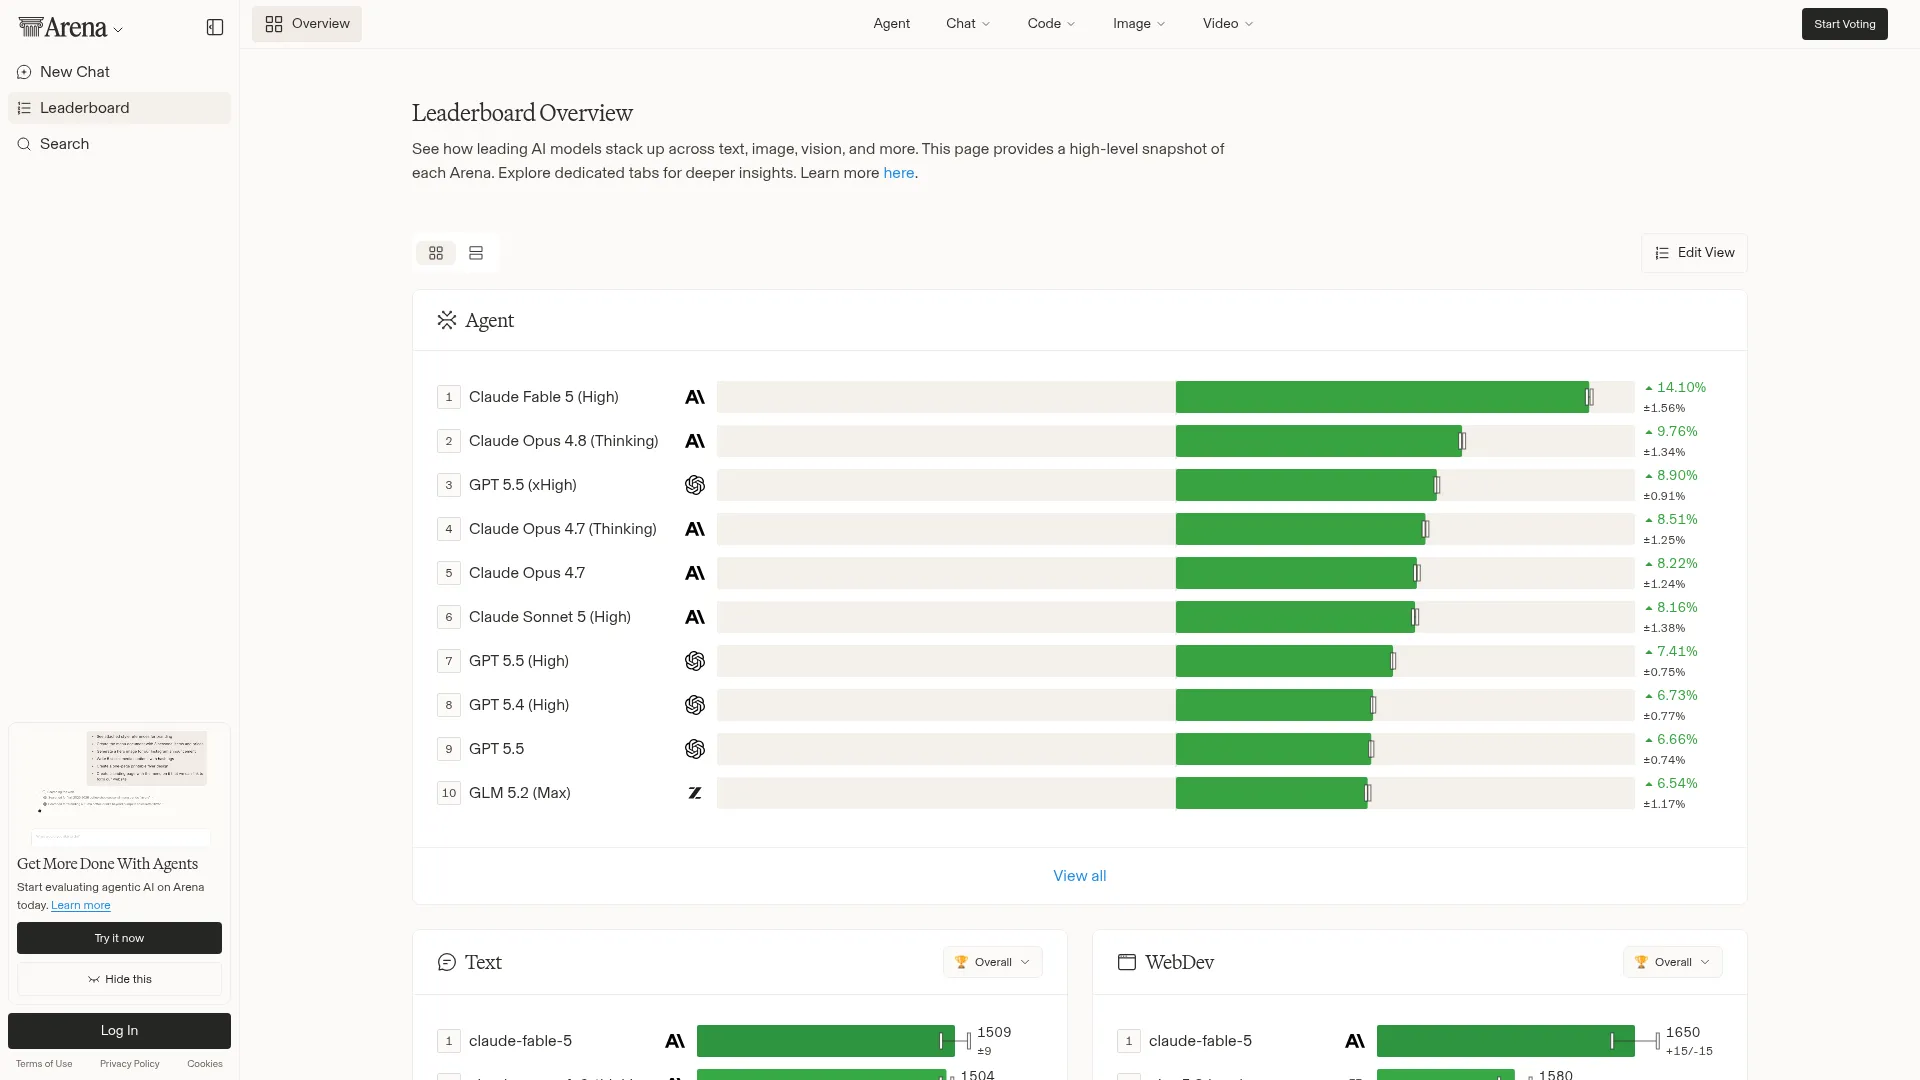
In early 2024, closed-source models led open-source by about 8% on the Chatbot Arena leaderboard. By February 2025, the gap had shrunk to 1.7%.
When Meta released Llama 3.1 405B, it briefly became the strongest open base model in the world, matching closed-source competitors on multiple benchmarks. DeepSeek-V3 did something arguably more impressive: it matched top closed-source models on MMLU and GPQA while using far less compute than anyone expected.
What this means: the decision "open or closed?" is no longer the interesting question. The interesting question is "which open model for which task?" For most solopreneur use cases — writing, research, content generation — a top-tier open-source model running through an inexpensive API provider is now competitive with Claude or the latest GPT at a fraction of the cost.
Q3 — How Fast Is China Catching Up?
The table that ended the "China is years behind" narrative:
Benchmark
End of 2023 gap (US vs. China)
End of 2024 gap
MMLU
17.5 pp
0.3 pp
MATH
24.3 pp
1.6 pp
HumanEval
31.6 pp
3.7 pp
MMLU went from a 17.5-point lead to essentially a tie (0.3 pp). HumanEval went from 31.6 to 3.7 points. That's catch-up at a speed very few analysts predicted.
The frontier itself is also getting more crowded. The Elo rating gap between the #1 and #10 model on Chatbot Arena shrank from 11.9% to 5.4%. The top two are within 0.7%.
Leo's read: when frontier models converge to within a percent or two, the competitive axis shifts. It's no longer "who has the best model." It's "who has the best product, the best distribution, and the most defensible data." If you're building anything on AI, you should be assuming model quality as commodity — and investing where differentiation actually lives.
Q4 — Can AI Write Code Now?
Almost.
On SWE-bench — a benchmark where models have to solve real GitHub issues — performance jumped from 4.4% in 2023 to 71.7% in 2024. That's a 67-point swing in one year.
But coding capability comes with a new paradigm. OpenAI's o1 and o3 models use "test-time compute" — they spend much more time thinking before answering. The results are striking:
o1 scores 74.4% on IMO qualifiers; GPT-4o scores only 9.3%
o3 hits 87.5% on ARC-AGI (human level on many tasks)
The cost: o1 is roughly 6× more expensive and 30× slower than GPT-4o. This is a "spend money for brains" trade — for high-value tasks (coding, math proofs, complex analysis), the math works. For quick back-and-forth, it doesn't.
Q5 — Are AI Agents Ready to Do My Work?
Short answer: for 2-hour tasks, yes. For 32-hour tasks, no.
The RE-Bench results — one of the most interesting findings in the whole report — showed this pattern:
Task duration
AI score vs. human experts
2-hour short task
4× the human score
32-hour long task
Human experts score 2× the AI
AI crushes short, bounded tasks. Humans still dominate long, strategic ones. This tells you where to deploy AI today (short bursts, bounded scope, well-defined goals) and where human time is still most valuable (long arc, judgment calls, ambiguity).
If you're an AWP-style solopreneur, this is actionable: offload the 2-hour tasks, keep the 32-hour ones. Writing a first draft? AI. Deciding what the year's editorial calendar should look like? You. This maps directly onto the four pillars of a durable one-person business — the pillars are the 32-hour work; the 2-hour tasks are what AI quietly absorbs underneath.
Q6 — How Much Money Is Flowing Into AI?
Almost too much, depending on where you're standing.
2024 totals:
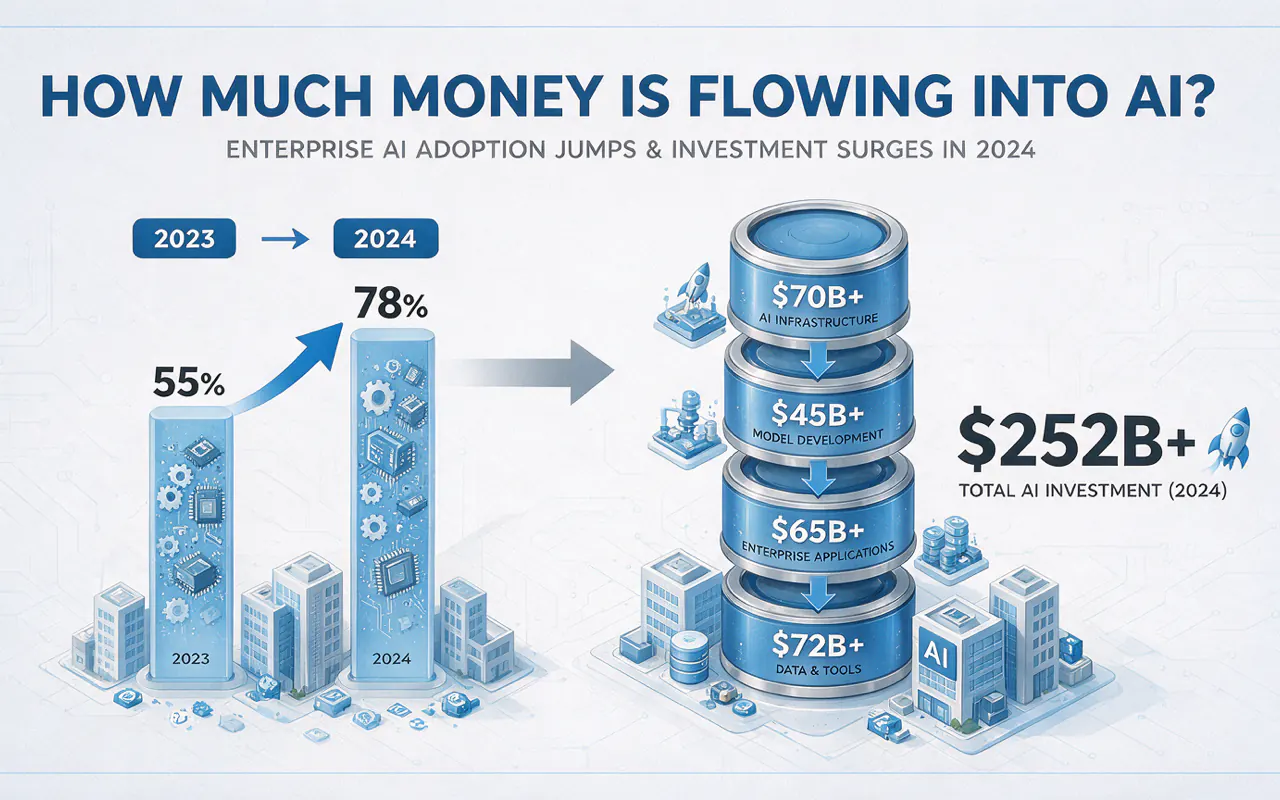
Total enterprise AI investment: $252.3B
Private AI investment growth: +44.5%
US private investment: $109.1B (12× China, 24× UK)
Generative AI alone: $33.9B — 8.5× the 2022 level
Enterprise adoption is also accelerating:
78% of organizations used AI in 2024 (vs. 55% in 2023)
71% used generative AI in at least one business function (vs. 33% in 2023)
AI went from "innovation experiment" to "standard operating procedure" in one year.
But here's the Stanford cold water: most companies report cost savings under 10% and revenue gains under 5%. The majority are still dabbling. The companies doing real AI transformation are a minority — which is both a warning and an opportunity. For solopreneurs, the bar for being an "AI-native" business right now is remarkably low. You just have to actually do it.
Q7 — Is Any of This Dangerous?
Yes, and the report doesn't pull punches on this chapter.
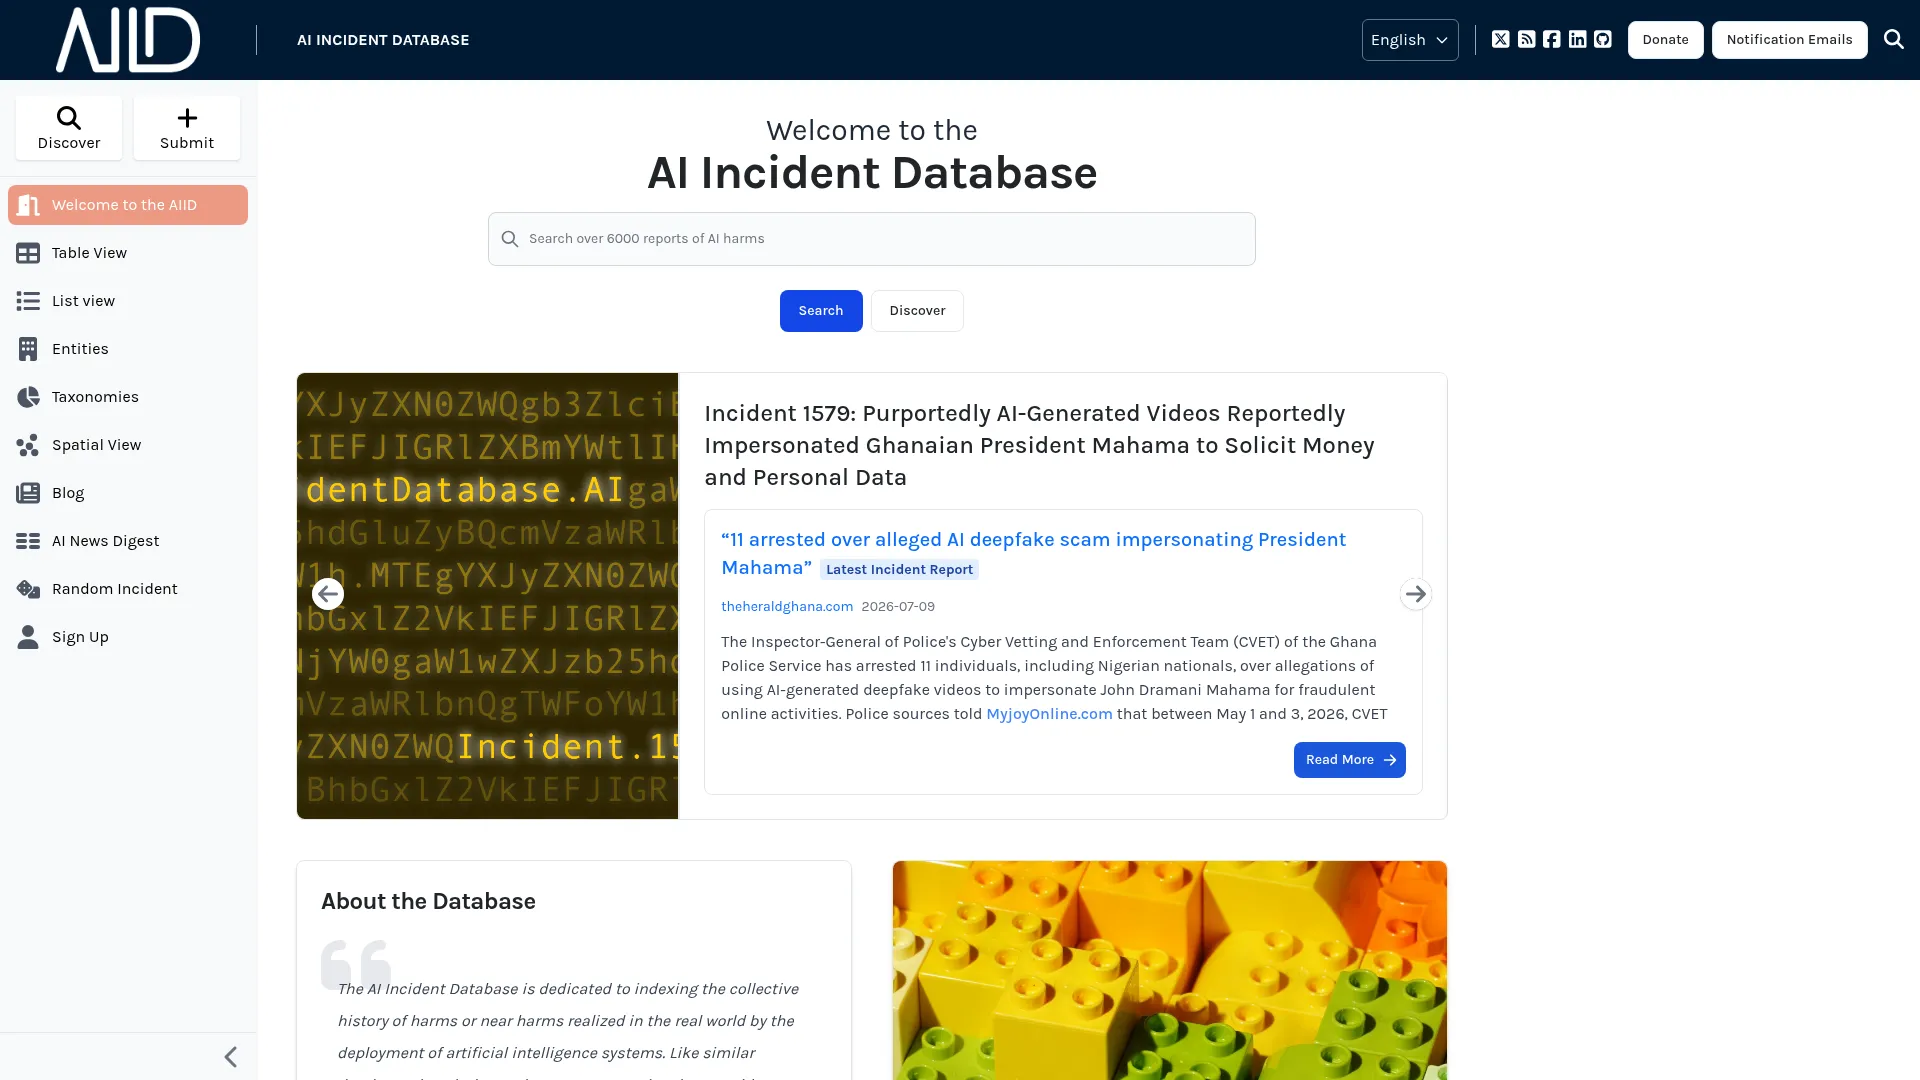
Incidents are rising fast. Reported AI incidents went from ~150 in 2023 to 233 in 2024 — a 56.4% year-over-year increase. Meanwhile, most major model developers do not run standardized responsible-AI evaluations. There are new benchmarks (HELM Safety, AIR-Bench, FACTS), but adoption is uneven.
Safety alignment is more fragile than it looks. Researchers found that just 6 steps of fine-tuning can push a model's harmful-output rate from 1.5% to 87.9%. More concerning: in a network of 1 million agents, "contagious jailbreaks" can spread from a single compromised agent to nearly all of them within 27-31 rounds. No practical mitigation exists yet.
The data commons is shrinking. The share of restricted tokens in the C4 training dataset jumped from 5-7% to 20-33%. More sites are blocking AI scrapers. The implication: companies with unique, proprietary data will become disproportionately valuable in the next 2-3 years as the open web becomes a worse training source.
Public trust is eroding. Chinese adults are 83% positive on AI. Americans are 39%. Trust in AI companies to protect user data fell from 50% to 47% in one year. Technology is getting more powerful; trust is getting more fragile.
Q8 — What Should I Actually Do With All This?
Three patterns cut across the entire report, and each one suggests a specific move.
Pattern 1 — The Cost Economics Flipped
Inference costs are collapsing. Small models match big ones. The AI economy is being rebuilt from the floor up. What used to be unaffordable 18 months ago is affordable today.
Action: audit your current AI tool stack this week. List every AI service you pay for. Compare current costs to what the same capability would cost on a small efficient model via an inexpensive API provider (Groq, Together, Fireworks, Replicate). Most non-programmers will find that at least one expensive line item can be cut by 50-90% with no quality loss.
Pattern 2 — The Frontier Is Crowded
Top-tier models are now nearly indistinguishable on benchmarks. Differentiation is moving to data, distribution, and product experience.
Action: if you're building something on top of AI, stop chasing "the best model." Pick a model that's good enough, and invest your remaining time on what isn't commoditized — your audience, your positioning, your unique data. The model is not your moat. Your customer relationship is.
Pattern 3 — Governance Is Lagging
Incidents up, safety uneven, data commons shrinking, trust declining. Meanwhile, governments are pouring tens of billions into AI capacity but running years behind on regulation.
Action: don't wait for rules to catch up. If you're building or deploying AI in a customer-facing product, adopt a minimal responsible-AI checklist yourself — disclose AI involvement, don't train on user data without consent, keep a simple incident log, have a plan for when things go wrong. Trust is becoming the hardest thing to win back once lost. Earning it early is cheap; rebuilding it is expensive.
Three Numbers to Watch Through 2026
Stanford's report is backward-looking — it captures 2024 as best anyone can. If I had to pick three leading indicators from this data to watch through the rest of 2026, these are the ones whose direction will tell you most about what the year actually becomes:
1. Inference cost for "good enough" models (the $0.07 number). If that floor keeps falling at anything close to the 280× pace, the economics for AI-native small businesses get qualitatively easier every quarter. Practical tip: pick one monthly AI spend line item and re-check its cost against an alternative provider every 60 days. I keep a running spreadsheet. The median delta I see is ~30% cheaper per quarter — worth the 10 minutes.
2. The open-vs-closed gap on Chatbot Arena (the 1.7% number). If it widens back to 5%+, closed models are pulling away and premium tools stay worth their premium. If it closes further to under 1%, it's time to take the open-source argument seriously even for customer-facing work. I check this monthly.
3. Reported AI incidents (the 233 annual total). If the number accelerates past ~80 per quarter sustained, expect regulatory response faster than the current 2028 timeline. That matters because every solopreneur planning around a stable regulatory horizon is making an implicit bet on this indicator. The November 2026 OpenAI trial is the single biggest discrete event that could move this number.
Each of these numbers compresses an enormous amount of uncertainty into a single observable. Pick two to watch. Skim past most of the rest.
What This Means for What I'm Building
As someone running a one-person content business on AI tools, the Stanford findings changed three concrete things about my plan this year:
I'm running quarterly cost audits instead of annual ones. Inference costs change too fast to set a budget once and forget it. Last year's ratio doesn't predict this year's.
I stopped optimizing for which LLM I use. Claude Code, Opus, Sonnet — they're all close enough. I spend my attention now on what I write, not who writes it.
I'm treating my own audience data as the asset. The report makes clear that proprietary data is becoming more valuable as public scraping gets harder. AWP's newsletter list, my reader feedback, my own notes — these are increasingly the most defensible thing I own.
Key Takeaways
Inference cost fell 280× in 18 months — running GPT-3.5-level in Nov 2022 cost $20/M tokens; by Oct 2024 it was $0.07. The "using" cost curve is collapsing faster than the learning curve
The open-source gap shrunk from 8% to 1.7% — for most solopreneur use cases (writing, research, analysis), a top open model is functionally equivalent to Claude or the latest GPT
US-China MMLU gap closed from 17.5pp to 0.3pp in one year — the "China is years behind" narrative ended in 2024. Frontier is a 10-way tie now
AI Agents: 4× humans on 2-hour tasks, humans 2× on 32-hour tasks — offload short bounded work, keep the strategic long-arc judgment
78% of organizations used AI in 2024 — up from 55%. But most report <10% cost savings and <5% revenue gains. The bar for "AI-native" solopreneur is lower than it looks
Safety incidents up 56.4% YoY, trust fell from 50% to 47% — the capability-safety gap is widening, and it's asymmetric risk for small operators
Ready-to-Use Prompt: Decode the Stanford AI Index's Eight Numbers Into Actions for What You Build
What this does: Interprets the eight Stanford HAI AI Index numbers TOGETHER (cost collapse, open/closed convergence, coding benchmark, adoption, China gap, incidents, model-gap compression, investment) for what you build, reads the meta-pattern, and turns it into three actions plus three numbers to watch — because cherry-picked headlines mislead and the real story needs all eight side by side. Based on: The Stanford 457-Page AI Report: 8 Numbers That Change Everything — https://aiworkflowpro.com/stanford-hai-ai-index-2025/ Time to run: ~5 minutes
Copy this prompt into Claude Code, ChatGPT, or any AI assistant:
ROLE: You are an AI-strategy analyst reading the Stanford HAI AI Index. Your job: interpret the eight headline numbers TOGETHER (not cherry-picked) for one builder's context, and turn the pattern into specific actions — because the headlines mislead and the real story only shows when the eight sit side by side.

CONTEXT — 8-NUMBER AI INDEX DECODER:
The Stanford HAI AI Index 2025 is 457 pages, but popular coverage cherry-picks the three or four most clickable numbers — and that misleads. The real story shows only when eight findings sit together (18 months ago → today): inference cost fell 280× ($20→$0.07 per million tokens); the open-vs-closed gap closed from 8% to 1.7%; the SWE-bench coding benchmark leapt 4.4%→71.7%; org AI use rose 55%→78%; the US-China MMLU gap nearly closed (17.5pp→0.3pp); AI incidents rose ~150→233; the top-1-vs-top-10 model gap compressed 11.9%→5.4%; and private AI investment kept flowing. Read together: cost collapse + capability surge + risk rise + field compression — the pattern, not any single number, drives the decision.

INPUTS (fill in before running):
- YOU_BUILD: YOUR_WORK_HERE (what you build — product, content, services)
- COST_SENSITIVITY: YOUR_STANCE_HERE (cost-sensitive / moderate / indifferent)
- RISK_APPETITE: YOUR_STANCE_HERE (move fast / balanced / cautious)
- HORIZON: YOUR_TIMELINE_HERE (this quarter / this year / 2-3 years)

METHOD — 6 STEPS:

Step 1 — Interpret the cost collapse (Q1)
The 280× inference cost drop ($20→$0.07/M tokens) means AI features that were uneconomic 18 months ago are now nearly free. For YOU_BUILD, name one feature you previously rejected for cost that is now viable. If COST_SENSITIVITY = high, this is your biggest lever.

Step 2 — Interpret the capability surge (Q2 + Q4)
Open-vs-closed converging (8%→1.7%) plus SWE-bench (4.4%→71.7%) means capable open models can now write real code near closed-model quality. For YOU_BUILD, decide: ship AI features on cheap/open models, and treat AI coding as production-ready, not experimental.

Step 3 — Interpret adoption + the agent question (org use + Q5)
Org AI use at 78% means AI is mainstream, not edge — your customers expect it. Pair with the agent-readiness question: route the repetitive 70% to agents, keep judgment work human, until the reliability gap closes.

Step 4 — Interpret risk + field compression (Q7 + top-1/top-10)
Incidents up 56% (150→233) and the top-1/top-10 gap compressing (11.9%→5.4%) mean: risk is rising AND no single model stays dominant long. Build model-portable (do not lock to one provider) and add safety review as incidents rise — against RISK_APPETITE.

Step 5 — Interpret the meta-pattern
Read the eight together: cost collapse + capability surge + adoption mainstream + risk rising + field compression + capital flowing. The meta-pattern (not any single number) is: build now, build portable, automate the routine, and budget for safety — the window where this is a competitive edge is open but narrowing.

Step 6 — Turn it into three actions + three numbers to watch
Give three specific actions for YOU_BUILD on HORIZON. Then name the three numbers to watch through 2026 (inference cost, agent reliability/benchmarks, incidents) so the reader re-runs this when they move.

RULES:
- Interpret the eight TOGETHER — never cherry-pick one number; the pattern is the point.
- Cost collapse makes previously uneconomic features viable — name one to revive.
- Build model-portable — the top-1/top-10 gap means no provider stays dominant; do not lock in.
- Automate the routine 70%, keep judgment human — agents are partially ready, not fully.

OUTPUT FORMAT:
Output six sections:
1. **Cost collapse implication** — the feature to revive for YOU_BUILD.
2. **Capability surge implication** — open models + AI-coding-as-production decisions.
3. **Adoption + agent implication** — the mainstream expectation + the 70%/judgment split.
4. **Risk + portability implication** — model-portability + safety-review stance for RISK_APPETITE.
5. **Meta-pattern** — the eight-number pattern read together.
6. **Three actions + three numbers to watch** — markdown table with columns: Action | Why (which number), + the three numbers to track through 2026.
Save as @templates/stanford-hai-ai-index-2025.md and run to set AI strategy from the Index, then re-run when the three tracked numbers (cost, agent benchmarks, incidents) move meaningfully.
Frequently Asked Questions
Is the 2025 report still relevant in April 2026?
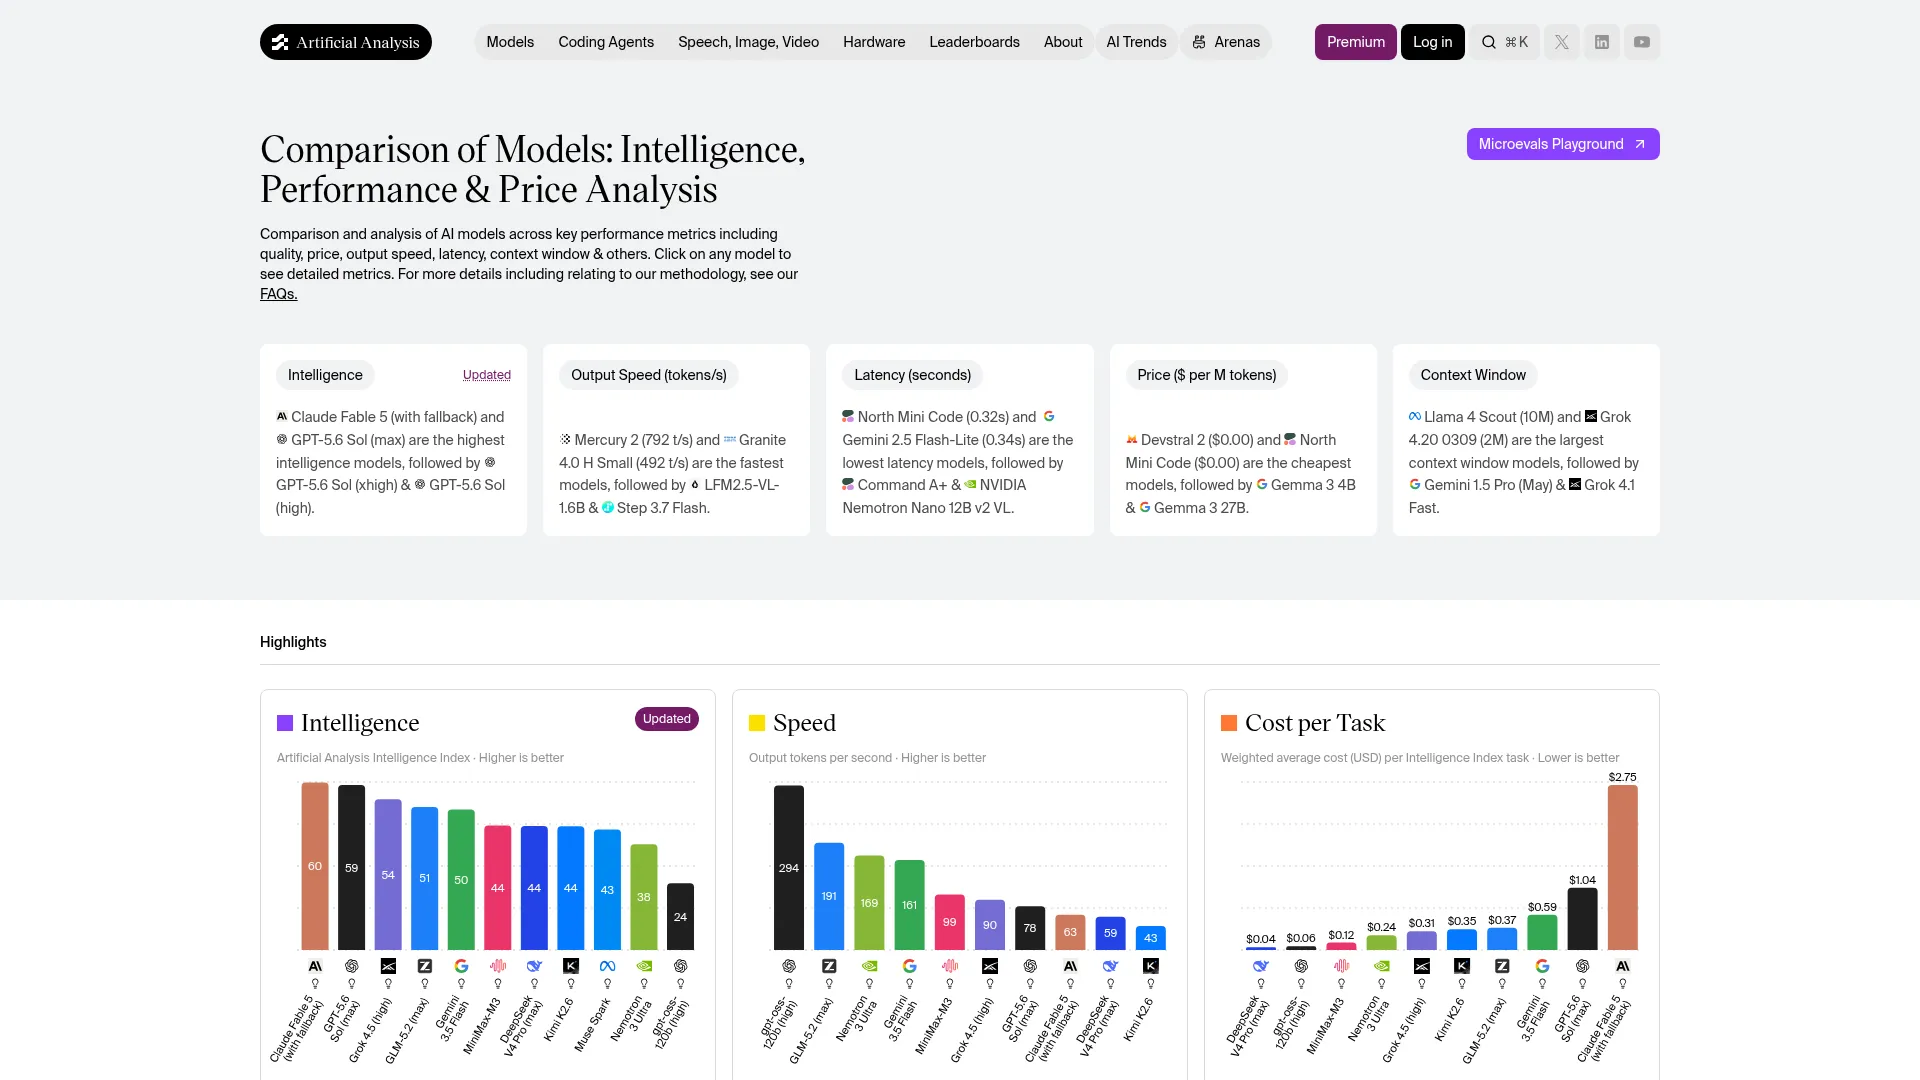
For the structural patterns, absolutely. The cost curve, the convergence on benchmarks, the enterprise adoption story — those are macro trends that don't reverse in 12 months. For specific point-in-time numbers (latest inference cost, latest top model on Arena), you'll want to refresh with more recent sources like Chatbot Arena or Artificial Analysis. The 2026 HAI report is expected in April 2026 and will update the numbers.
I'm not technical. What's the one thing I should remember?
The barrier to using AI is collapsing faster than the skills to use it well. In 2026, the gap between people who are fluent with AI tools and people who aren't is the biggest productivity divide in knowledge work. Stop waiting to learn; spend an hour a week using AI for something real.
Is open-source really good enough for serious work?
For most non-coding, non-safety-critical tasks, yes. The 1.7% gap Stanford reports is real — a good open-source model (Llama, DeepSeek, Qwen) does 98% of what a closed-source model does for content work, research, and analysis. The remaining 2% matters for specific use cases (agentic coding, very long context, highly specialized reasoning). For most solopreneurs, it won't.
What's the single biggest risk the report flags?
The safety-capability gap is widening, not narrowing. Capabilities are doubling every 6-12 months; safety infrastructure is advancing on a multi-year timeline. Incident counts are up 56.4%. If one of the next big AI incidents is large-scale enough to trigger aggressive regulation, that risk is asymmetric — it hurts small, fast-moving operators (like solopreneurs) more than it hurts well-capitalized companies that can afford compliance overhead.
How credible is the AI Index overall?
Very. Stanford HAI is not commercially aligned, the methodology is transparent, and they triangulate across 20+ data sources (OECD, McKinsey, Ipsos, Chatbot Arena, arXiv, FDA, USPTO). It's the closest thing to a "canonical snapshot" of the AI field. Citing it is how you signal you've done homework beyond Twitter threads.
Eight folders of plain Markdown, a CLAUDE.md index in each, and seven prompts that make your agent interview you. Every prompt, template and command from the video, in order.
Stop briefing your AI from scratch. One free folder holds your background, your rules and your voice. Eight prompts build it, no code, and any AI can read it.
Monitoring a competitor who publishes no feed is the case every RSS guide skips. Twenty-one platforms sorted by which of three jobs they do, and the finished setup is business process automation you own outright, with no seat licence to renew.
Blaming the content is the reflex when a post underperforms, and it is usually the wrong diagnosis. A second reader decides distribution before any human sees the post, and most of what it checks is mechanical enough to automate business processes around, on five platforms at once.