Monitoring a competitor who publishes no feed is the case every RSS guide skips. Twenty-one platforms sorted by which of three jobs they do, and the finished setup is business process automation you own outright, with no seat licence to renew.
Blaming the content is the reflex when a post underperforms, and it is usually the wrong diagnosis. A second reader decides distribution before any human sees the post, and most of what it checks is mechanical enough to automate business processes around, on five platforms at once.
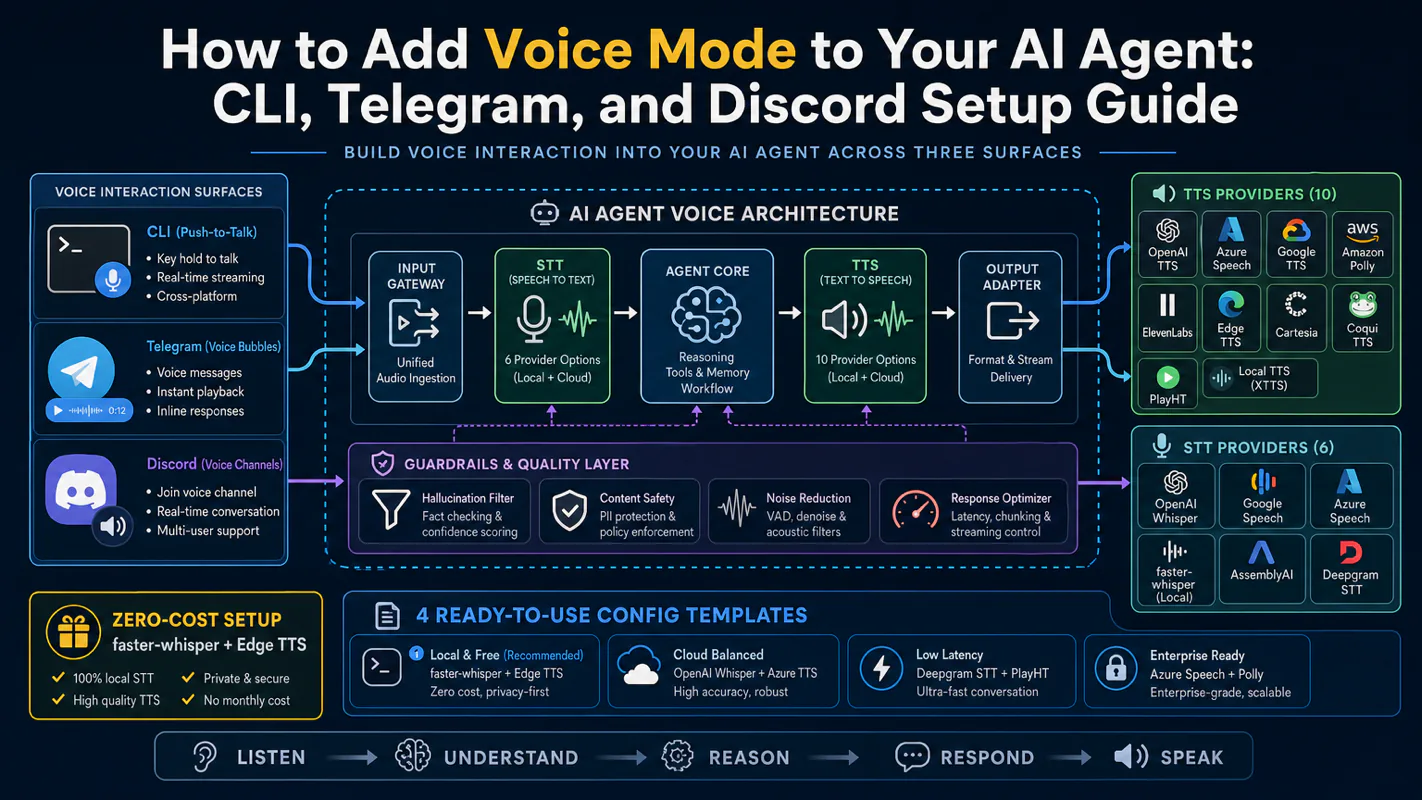
Gloves on, tape measure in hand — nobody types a query. Three voice surfaces for ai automation tools (terminal, Telegram, Discord), 10 TTS and 6 STT providers compared on cost and latency, plus a setup that costs nothing.
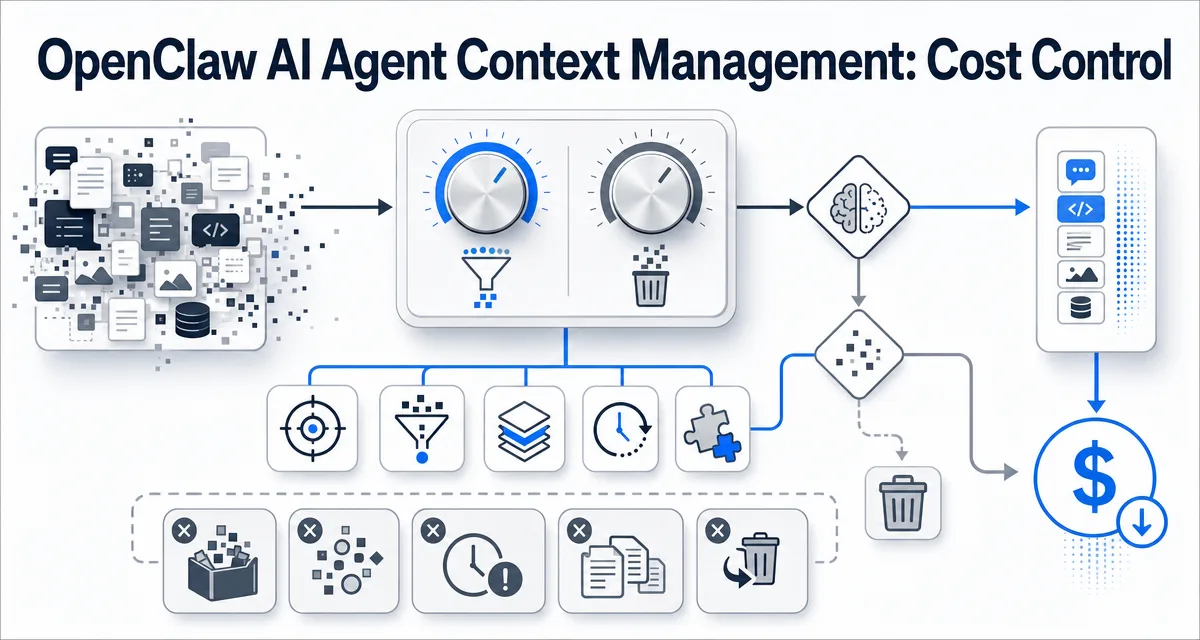
OpenClaw AI Agent Context Management: Cost Control
Every token the model sees gets paid for, on every single call. That is the one line on the invoice nobody budgets for — and it is also the one you have the most control over, once you can see it.
TL;DR: AI agent context management is the single biggest cost lever in any agent runtime. Context is the working space the model sees on every call, and every token in that space gets paid for, every call. Compaction summarizes long conversations; pruning trims bulky tool output; together they keep the agent sharp instead of bloated. Get the dials wrong and the same agent costs 5x more for a worse answer.
Run the numbers before you run the automation. A process that takes a person twenty minutes costs you twenty minutes of salary; the same process handed to an agent costs you every token it reads, every time it thinks, on every call — and unlike the salary, that number grows quietly as the conversation gets longer. Plenty of AI automation tools look cheap in the demo and stop making sense in week three for exactly this reason. The good news is that this is the most controllable cost in the whole stack, and most of it comes from two habits.
Everyone says context is just "the message history." Actually, in a working agent runtime context is system prompt, tools schemas, identity files, memory, history, plus tool output, all packed into one input package per model call. The history view is wrong, and that wrong view is what makes context bills surprising.
If you already shipped a long-running agent, skip ahead to §5 for the five practices. If you are still working out why hour 4 feels slower than hour 1, read on.
You ask a fresh agent: "what time is it in Tokyo?"
It replies in 1.5 seconds.
You spend two hours having a real conversation with the same agent, sharing decisions, looking at logs, asking follow-ups. Then you ask: "what time is it in Tokyo?"
It replies in 6 seconds. And you just paid 5x more for the same answer.
Honestly? Try this question: what changed between the two questions?
The model didn't get slower. The runtime didn't change config. What changed is the agent's working memory, the context window — went from 8,000 tokens to 50,000 tokens. Every token in that window gets sent to the model on every call. So the second "what time is it" carried 50K of unrelated history along with the question.
This is the most expensive misunderstanding in agent operation. Context is finite, context costs money, and context grows non-linearly with conversation length. Managing it is what separates a runtime that gets cheaper as you get good at it from a runtime that quietly burns dollars.
If "agent runtime" still feels new, two short maps to keep open:
Counting the Budget: How Big Is Your Agent's Working Space
Modern Claude / GPT models have context windows in the 100K-1M token range at time of writing. That sounds enormous. Then you measure your actual agent and discover that "enormous" is exactly enough.
A typical OpenClaw call breaks down something like this on a fresh session:
Component
~Tokens
Notes
Safety rules
2,000
Hard constraints, fixed
Tool schemas
4,000
Every tool's name, params, description
Skill list
500
Available higher-level routines
Runtime info
500
Time, env, version
SOUL.md
800
Agent identity
AGENTS.md
2,000
Working principles
USER.md
300
User profile
IDENTITY.md
100
Name plate
TOOLS.md
500
Tool routines
Today + yesterday's memory log
1,000
Recent events
MEMORY.md
500
Long-term notes
Conversation history
0 (fresh)
Empty at session start
Your message
50
"what time is it"
Fresh session total: ~12,250 tokens. That's the floor, the model is reading 12K of handbook before even seeing your message. On a 200K window, you have ~187K left for actual work.
After two hours of real work, the same call looks like:
Component
~Tokens
Change
(everything above, unchanged)
~12,000
Floor stays the same
Conversation history
30,000
Two hours of back-and-forth
Tool output history
18,000
Logs, file dumps, search results from earlier rounds
Your message
50
"what time is it"
Active session total: ~60,000 tokens. Five times the floor for the same one-line question.
This is the core fact: the cost of asking the agent something depends much more on what came before than on what you actually asked.
What Happens Without Context Management
If you let context grow forever, three things happen in order.
First, latency degrades. Models read tokens linearly. A 60K input takes 3-4x longer than a 12K input on the same hardware. Your "instant" replies stop feeling instant.
Second, costs compound. Token billing is linear with input size. A heavy session can cost 8-10x what a light session costs, for the same kind of work. I had a single Tuesday early in my OpenClaw use that cost $14 in API spend, traced almost entirely to one runaway loop where tool output piled up unchecked.
Third, this is the worst — the model gets confused. Modern models are remarkably good at finding signal in noise, but they're not magic. When 80% of the context is stale tool output from an investigation that finished an hour ago, the model's attention spreads thin. You start getting weirdly out-of-context answers. The model isn't broken; it's drowning in your own history.
The fix isn't a bigger model. The fix is active management of what's in the window.
The Two Big Dials: Compaction and Pruning
Here is why this matters: every wasted token in context is paid for on every model call after that token entered. A 5,000-token tool output that should have been pruned at round 3 will get re-billed at rounds 4 through 12. Knowing the dials saves real money.
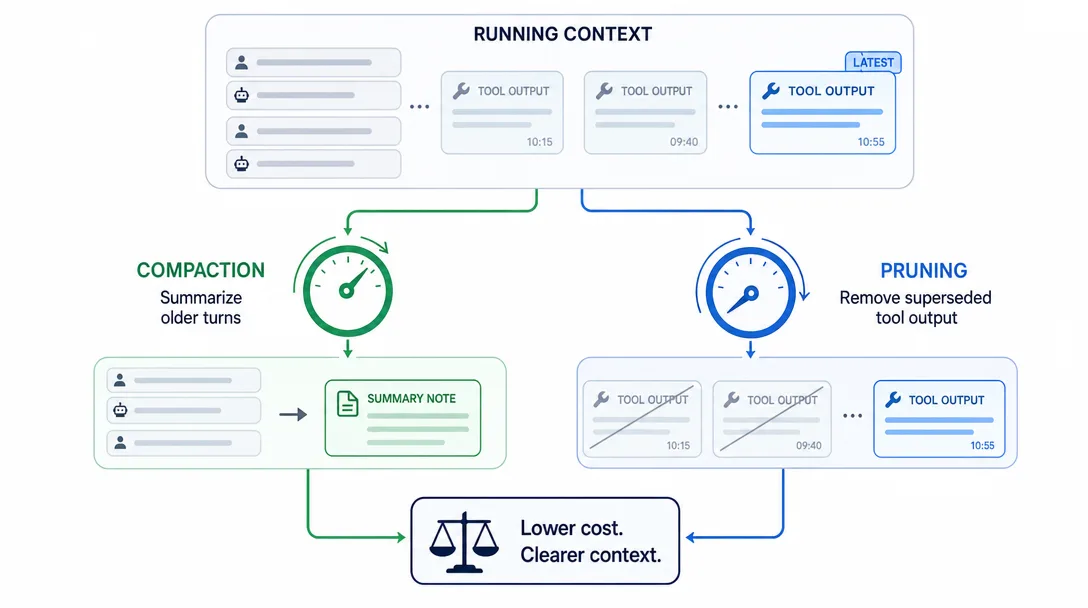
OpenClaw separates context management into two distinct mechanisms with different jobs and different triggers.
Mechanism
What it summarizes
When it runs
What it preserves
Compaction
Conversation history (your turns + agent turns)
When the session nears the model context limit, or after a context-overflow error
Chronological order of intent and decisions
Pruning
Old tool results (file reads, command output, search results)
In contextPruning.mode: "cache-ttl" after the cache TTL expires
Recent evidence; older bulky results are trimmed or cleared in the prompt view
The shorthand: compaction is for what humans said, pruning is for what tools returned. Mixing them up is a common mistake, I'll come back to it in §7.
3.1 Compaction: the meeting-minutes pass
Compaction works the way meeting minutes work. The original 90-minute discussion gets compressed into 5 paragraphs that capture intent, decisions, and open questions. You lose the verbatim wording. You keep the gist.
When the runtime decides to compact, it sends the older portion of conversation history back to the model with a prompt like: "summarize the following exchange, preserving decisions and outstanding questions, removing chitchat and resolved tangents." The model returns a compact summary. The original turns get replaced with that summary in the working context.
Two consequences:
Compaction is lossy by design. Specific phrases — "use top not htop" — can disappear into "discussed monitoring tools."
Compaction is cheap if you set it up right. Anthropic's prompt caching, at time of writing, can cache the compacted prefix so subsequent calls don't re-pay for it.
This is exactly why memoryFlush exists (Part 4 § 6) — to salvage important specifics into memory files before compaction summarizes them away.
3.2 Pruning: trimming the appendix
Pruning works the way you trim a long email thread before forwarding it. The recent messages stay in full. Earlier messages collapse into "see attached / earlier discussion" with maybe a one-line summary.
Tool output is where pruning earns its keep. A single exec that reads a 4,000-line log file dumps 4,000 lines into the agent's context. By round 5 of the loop, the agent is building its final answer based on the most recent tool result, that 4,000-line log is now context-window weight without context-window value.
Pruning trims older tool output in the prompt view. Oversized results can be soft-trimmed, keeping the head and tail with an ellipsis, and older bulky results can be replaced with placeholders. The on-disk transcript is not rewritten.
[old tool result removed from model context; full transcript remains on disk]
The agent keeps the recent evidence it still needs, but it doesn't carry every raw 4,000-line dump forward forever. In my measurements, pruning cuts mid-loop context size materially on investigation-style tasks.
3.3 Compaction vs pruning, side by side
The two mechanisms are easy to confuse. The clearest split:
Question
Compaction
Pruning
What does it act on?
Human + agent conversation turns
Tool output (exec, read, web_fetch, etc.)
What's the trigger?
Near the model context limit, or provider context overflow
Cache-TTL pruning window when contextPruning.mode is enabled
What's the unit?
A range of older turns
A specific past tool result
What survives?
A summary in place of the original turns
Recent evidence plus placeholders/trims for older output
When does it run?
Auto-compaction or manual /compact
Before model calls after the pruning TTL expires
Cost to user?
Lose verbatim phrasing
Lose raw evidence
If you only set up one, set up pruning. Tool output is what blows up context fastest.
The Compaction Process, Step by Step
When the session approaches the model's context limit, or a provider returns a context-overflow error, the runtime executes a small sub-flow:
Identify the boundary — split history into "recent" (keep verbatim) and "old" (compact).
Run memoryFlush first — give the agent a chance to extract durable facts into memory files before compaction summarizes older turns. (See Part 4 for the full memoryFlush flow.)
Compact the old portion — send it to the model with a "summarize preserving decisions and intent" prompt.
Replace — the old portion in working context becomes the summary; the recent portion stays untouched.
Persist — the compact summary is saved in the session transcript. The full history remains on disk; compaction changes what the model sees next, not whether you can inspect old records.
The whole sub-flow takes a short extra turn. It runs when the session nears the model context limit, hits a provider overflow, or meets a configured transcript guard, then waits until the compacted session grows enough to need another pass.
I had a Sunday morning where the agent suddenly "felt different" mid-conversation. Friendlier in tone, more terse in answers. I checked the trace: compaction had just fired. The model had summarized our previous 90 minutes of dense back-and-forth into 8 sentences, and the new context primed a noticeably different working personality. Compaction can subtly shift agent behavior. I added a SOUL.md rule for tone consistency the same day, since SOUL.md never gets compacted.
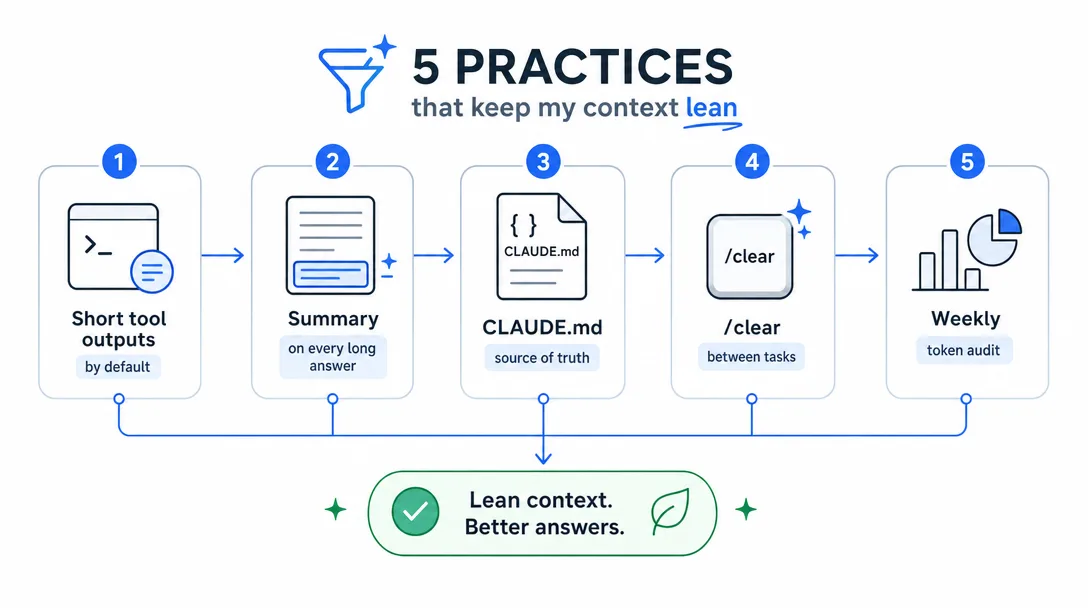
The five practices that keep my context lean
Before pruning, a long-running agent fills its window with stale tool output. After, the same window holds a tight summary of decisions plus only the last few tool results. Same model, much cheaper, much sharper answers.
Across the agents I run on a daily basis, five operational habits cut my context costs in half compared to my first month.
5.1 Pin durable rules to SOUL.md, not chat
Anything you find yourself repeating to the agent more than twice, write it into SOUL.md. SOUL.md is loaded on every call but never compacted. It costs you ~100 tokens of base; it saves you the cost of repeating the rule 50 times across the next month.
5.2 Use sub-agents for big tool tasks
A long file read, a deep search, a multi-step analysis, these are all candidates for spawning a sub-agent. Sub-agents have their own context that gets discarded when they finish. They report back a summary, not the raw work. Your main agent's context stays clean; the sub-agent's bloated context dies on completion.
5.3 Enable cache-TTL session pruning where it fits
Current OpenClaw exposes pruning as agents.defaults.contextPruning, with mode: "cache-ttl" and a TTL such as "5m". For tool-heavy agents (data analysis, log triage), enabling cache-TTL pruning keeps old tool output from dominating the prompt. For non-Anthropic providers, verify provider behavior first; the official docs call out Anthropic prompt-cache optimization as the main case where this pays off cleanly.
5.4 Keep MEMORY.md curated
A 4,000-line MEMORY.md is loaded on every call. That's potentially 30,000 tokens of base load before any conversation. Curate weekly: archive entries unused for 30 days, consolidate redundant notes, prune contradictions. A 600-line MEMORY.md is the right shape; if yours is bigger, half of it is probably noise.
5.5 Inspect context regularly
OpenClaw exposes /status, /context list, and /context detail for context inspection. The first time I ran the detail view, I discovered that AGENTS.md had grown to 8K tokens because I'd been adding rules without curating. Trimmed it to 2K. Latency dropped 30%. What you can't measure, you don't manage.
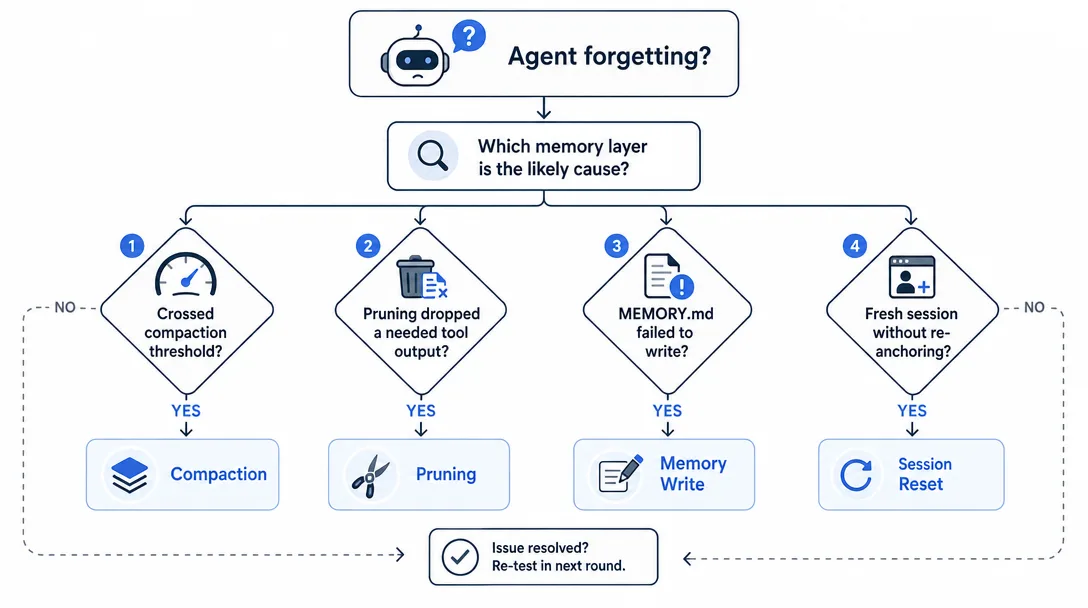
When the Agent "Forgets": Diagnostic Flow
The most common context bug is "the agent stopped knowing X mid-conversation." The diagnostic walk is short:
Step
Check
Likely cause
1
Was X said in this session?
If no, X never made it into context, write to SOUL.md or MEMORY.md
2
Did auto-compaction run?
If yes, X may have been summarized away
3
Was memoryFlush enabled?
If no, that's the gap, X had no chance to escape compaction
4
Is X in MEMORY.md?
If no, the rule never graduated, write it explicitly
5
Is X in SOUL.md?
If yes, the loading might have failed, check for syntax errors
90% of "the agent forgot" cases are step 2 + step 3: compaction fired before the important fact was written somewhere durable. The fix is structural, not corrective. Once memoryFlush, MEMORY.md, and stable SOUL.md/AGENTS.md rules are in place, this class of bug largely stops happening.
6.1 A real diagnostic walkthrough
Here's a real Sunday-morning incident from my own logs that walked the diagnostic path above.
Symptom: my server-watcher agent suddenly started recommending htop for memory inspection, even though three weeks earlier I'd told it "the container doesn't have htop, use top."
Step 1: was the rule said in this session? No, last said weeks ago. So it had to be in MEMORY.md or SOUL.md. I checked MEMORY.md. The rule was there, in the deploy preferences section.
Step 2: had compaction fired? I checked the trace file. compaction.fired: true four times in the past hour. Yes, multiple times.
Step 3: memoryFlush enabled and writable? Yes, but the workspace had become noisy and the relevant rule was buried. On long sessions, the pre-compaction flush can only save what the agent recognizes as durable.
Step 4: was the rule still in MEMORY.md? Yes, but loading order had subtly changed after I added a new section above it. The model was reading the new section first, applying its rules, and the older "use top not htop" rule was being overshadowed by a newer "investigate fully" rule that nudged toward more verbose tools.
Step 5: SOUL.md? The rule wasn't there. It had never graduated.
The fix: reordered MEMORY.md so the older rule sat in a clearly-labeled "ENVIRONMENT CONSTRAINTS" section above the newer "INVESTIGATION STYLE" section; promoted the rule to SOUL.md as part of a one-line "Container limits" fact. Symptom resolved. The bug wasn't context management; it was three small drift effects compounding. Diagnostic walks like this are what make the runtime feel debuggable rather than mysterious.
The Parameters That Matter (With the Values I Actually Use)
OpenClaw exposes more knobs than you'll typically tune. Here are the ones that move the needle, with defaults and the values I run at time of writing:
Parameter
Official location
My starting value
What it controls
contextPruning.mode
agents.defaults.contextPruning
cache-ttl for tool-heavy Anthropic profiles
Whether old tool results are trimmed in the prompt view
contextPruning.ttl
agents.defaults.contextPruning
5m
How long a cache/pruning window lives before a fresh pruning pass
keepRecentTokens
agents.defaults.compaction
leave unset first
How much recent transcript manual /compact keeps verbatim
maxActiveTranscriptBytes
agents.defaults.compaction
unset, or "20mb" for long-lived agents
Optional local transcript byte guard before a run
truncateAfterCompaction
agents.defaults.compaction
true only when using byte guard
Rotate to a smaller successor transcript after compaction
memoryFlush.model
agents.defaults.compaction.memoryFlush
local model only if needed
Model override for the silent pre-compaction memory flush
memoryFlush.softThresholdTokens
agents.defaults.compaction.memoryFlush
leave default first
Configurable buffer before compaction pressure where memory flush should happen
notifyUser
agents.defaults.compaction
false
Whether users see compaction start/complete notices
7.1 safeguard vs aggressive: two philosophies
agents.defaults.compaction.mode has two modes that capture different bets:
safeguard (default): "preserve fidelity, accept higher cost." Keeps more verbatim. Better for high-stakes conversations where losing a specific detail is costly.
aggressive: "minimize tokens, accept some loss." Heavier compression. Better for batch jobs where the agent is processing many similar inputs and you don't need every conversation to remember the last one.
I run safeguard for personal-assistant-style agents (every detail matters) and aggressive for the cron-driven server-monitor agent (each run is independent; aggressive compaction costs nothing because there's no "next call" to confuse).
System Prompt Assembly: The Iceberg You Don't See
When the runtime assembles a model call, the system prompt is the part you don't usually read. Three modes affect its size dramatically:
A 3-agent setup where every sub-agent calls full mode burns ~30K tokens just on system prompts before any actual work. The same setup with main on full and sub-agents on minimal burns ~16K. The mode swap saves more tokens than any other single optimization.
8.1 Inspecting your own context
Two commands worth running once a week:
/status                            # Quick context/window/status view in chat
/context list                      # Injected files and rough sizes
/context detail                    # Per-file, per-tool, per-skill breakdown
openclaw gateway usage-cost --days 7
The slash commands give you "what does the agent see right now." The Gateway usage-cost command gives you "where did my budget go this week." I find a lot of unexpected weight in the detailed view, usually a logfile that some skill keeps re-reading instead of caching.
8.2 Cost awareness: tokens are time and money
For Claude Sonnet 4.6 at time of writing:
Input tokens: ~$3 per million
Cached input: ~$0.30 per million (90% discount, 5-minute TTL)
Output tokens: ~$15 per million
A heavy agent doing 50 model calls a day at 30K input each, no caching, runs about $4.50/day. The same agent with prompt caching enabled (so the SOUL.md + MEMORY.md prefix is cached across calls) drops to $1.50/day. Caching is the single biggest cost optimization after pruning.
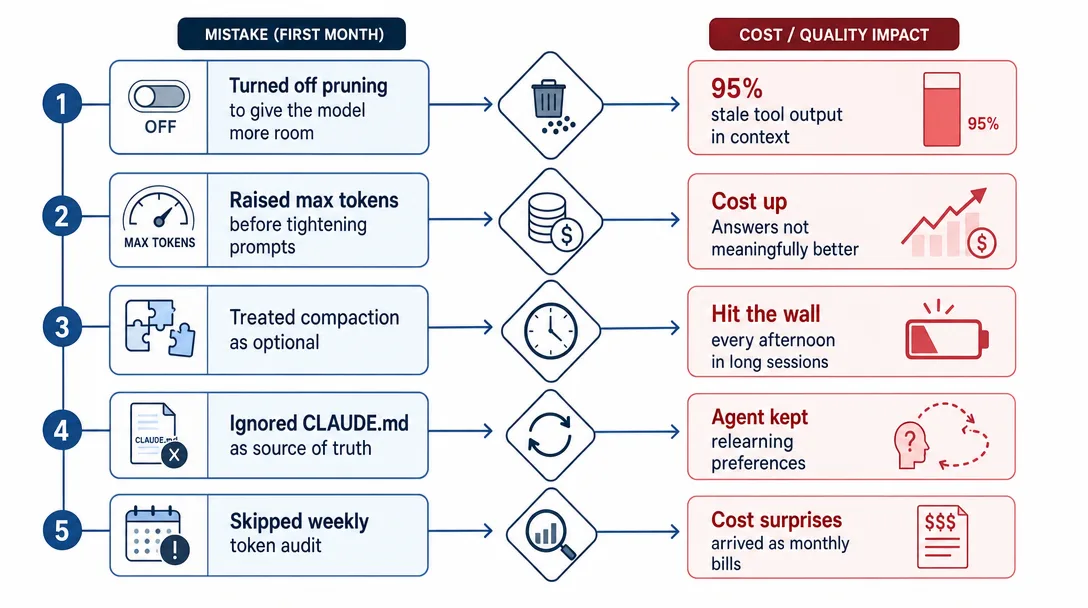
The 6 Mistakes I Made in My First Month
Save yourself my mistakes.
Mistake 1: I treated context as "free" until the bill arrived
I let context grow without limits because "models have huge windows now." First month's bill was $80 for an agent I'd estimated at $20. The bigger the window, the more rope you have to hang yourself. Treat context as a budget from day one.
Mistake 2: I disabled pruning to "give the model more evidence"
The agent got dumber. By round 14 of a deep investigation, 95% of the context was tool output from rounds 1-3 that the agent had already drawn conclusions from. Reasoning quality dropped. Older tool output isn't more evidence; it's clutter.
Mistake 3: I confused compaction with pruning
I tuned pruning thinking it would summarize the conversation. It doesn't, that's compaction's job. Pruning trims old tool results in the prompt view; compaction summarizes conversation turns. Set both, set them for their actual targets, and don't expect one to do the other's work.
Mistake 4: I didn't enable prompt caching
For two months, every call paid full price for the SOUL.md + MEMORY.md prefix. Once I enabled prompt caching, the same workload cost ~70% less. Anthropic's prompt cache is the single largest cost lever the runtime exposes. Turn it on day one.
Mistake 5: I didn't inspect my own context
I assumed the runtime had it under control. After actually running /context detail, I found three skills loading entire logfiles into context unnecessarily, and a MEMORY.md section that had ballooned to 1,200 lines. Fixed in an afternoon. The runtime gives you the visibility, use it.
Mistake 6: I tried writing a clever auto-tuner before learning the defaults
Embarrassingly, I built a small "auto-tune" hook that watched token usage and dialed memory-flush thresholds up and down based on time-of-day. It broke things. The threshold would shift mid-conversation, memory flush and compaction would fire at unexpected moments, and the agent would feel inconsistent. I ripped the hook out. Honestly? The defaults are good defaults. I tried to outsmart them before I'd lived with them, and lost two days to my own cleverness. AI agent context management invites over-engineering. Resist it. The dials were chosen by people who ran more agents than you have. Live with the defaults for two weeks before tuning anything except cache-TTL pruning and prompt caching.
I made this mistake because I assumed the agent's slowness was a context problem when it was actually a tool-loop problem. I thought the bottleneck was the window when the bottleneck was the loop. Diagnosing the right thing matters more than tuning the wrong thing aggressively. Run /context detail first, look at where the actual bytes are, then change one parameter and live with it for a week.
Side note: AI agent context management evolves with the model
A note worth setting alongside the mistakes. Optimal AI agent context management settings change as model capabilities change. As context windows and provider caching improve, "old conversation history" may be cheaper to keep around than it was when the first defaults were chosen. What's good practice today might be over-conservative in six months. Re-read your /context detail output quarterly and ask: "are these defaults still right for the model I'm actually using?" Compaction and pruning are timeless concepts; the specific thresholds aren't.
A 30-Minute Path: See Your Own Context Budget
Want to actually measure your context use tonight? Here's the path.
Run /context list now (3 min). Note the section sizes. The first time you'll be surprised by which thing is biggest.
Have a real 5-message conversation (5 min). Then /context detail. Watch which sections grew.
Trigger a tool-heavy task (5 min). Ask the agent to do something that requires 3-4 tool calls. Then /context detail. Watch tool output dominate.
Force a manual checkpoint (5 min). Run /compact Focus on the current task decisions. Compare /status before / after.
Enable cache-TTL pruning (5 min). Add agents.defaults.contextPruning: { mode: "cache-ttl", ttl: "5m" } where your provider/runtime benefits from it.
Enable prompt caching (5 min). Edit openclaw.json, restart. Run openclaw gateway usage-cost --days 7 after a few hours. Watch the bill drop.
Trim one bloated component (3 min). Whichever section was unexpectedly large in step 1, trim it. AGENTS.md and MEMORY.md are usually the wins.
Half an hour of this and context stops being abstract.
AI Agent Context Management Checklist
Layer
Ask this
Watch out for
Bootstrap floor
Bootstrap files concise? MEMORY.md only high-signal? Tool schemas bounded?
bloated floor = frequent compaction
Compaction
/status shows compactions? keepRecentTokens only tuned when needed?
Premature threshold tuning = drift
Pruning
contextPruning.mode set where useful? Sub-agents use lighter context?
No pruning = tool-output bloat
memoryFlush
Enabled? Saves durable details to memory files before compaction?
Off = details may survive only as vague summaries
Caching
Anthropic prompt cache enabled?
Off = paying full price for every call's prefix
Inspection
/context detail run weekly?
Without it, drift is invisible
How I Would Use This in a Real Setup
Don't tune every knob on day one. Three steps, in order:
Keep memoryFlush on and enable prompt caching. That's the cheapest two wins.
Enable contextPruning.mode: "cache-ttl" where the provider/runtime benefits from it, and live with the default compaction first.
Once a week, run /context detail. The day you find a section that surprises you, that's your tuning target.
Each step is small. The compound result, after a month, is an agent that costs half what it cost in week one and feels twice as sharp. Context management isn't optimization. It's hygiene.
Back when I ran personal automation on n8n, "context" wasn't really a concept, the workflow re-fetched everything every run, which was wasteful but bounded. Agents are different: they're conversations that grow. Without active context management, the conversation becomes a junk drawer the agent can't search. The runtime makes the dials visible. Turn them.
Ready-to-Use Prompt: Size Your Agent's Context Budget and Set the Two Cost Dials
What this does: Sizes your agent's full context budget (the iceberg, not just history), sets the two cost dials (compaction + pruning), runs the "agent forgot" diagnostic, tunes the parameters that matter (including prompt caching), and checks the six recurring mistakes — because wrong dials make the same agent cost 5x more for a worse answer. Based on: OpenClaw AI Agent Context Management: Cost Control — https://aiworkflowpro.com/openclaw-context-resource/ Time to run: ~5 minutes
Copy this prompt into Claude Code, ChatGPT, or any AI assistant:
ROLE: You are an agent context-cost engineer. Your job: size an agent's context budget, set the two cost dials (compaction and pruning), run the "agent forgot" diagnostic, and tune parameters — because context is the single biggest cost lever and wrong dials make the same agent cost 5x more for a worse answer.

CONTEXT — CONTEXT COST-CONTROL (2 DIALS):
Context management is the single biggest cost lever in any agent runtime. Context is not "message history" — it is the whole input package per model call: system prompt, tool schemas, identity files, memory, history, plus tool output, and every token in it is paid for every call. Two dials control it: compaction (summarize long conversations) and pruning (trim bulky tool output). Get them wrong and the same agent costs 5x more for a worse answer, and hour 4 feels slower than hour 1. The system prompt is the iceberg you do not see — most of the budget is fixed overhead, not history.

INPUTS (fill in before running):
- AGENT_SYMPTOM: YOUR_PROBLEM_HERE (cost too high / slows over time / "forgets" things / all)
- SESSION_LENGTH: YOUR_RUNTIME_HERE (short single-turn / multi-hour / long-running)
- TOOL_OUTPUT_VOLUME: YOUR_ANSWER_HERE (do tools return bulky output? yes/no)
- BUDGET_SENSITIVITY: YOUR_CONCERN_HERE (cost-critical / moderate)

METHOD — 6 STEPS:

Step 1 — Size the context budget (the iceberg)
Break the input package into: system prompt + tool schemas + identity/memory + history + tool output. Estimate each. Most surprise bills come from the fixed overhead (system prompt + schemas), not history — the "history" view is wrong. State which slice dominates.

Step 2 — Set the compaction dial
Define when/how to summarize: trigger compaction at a context threshold (not too early — loses detail; not too late — already bloated), summarize the older conversation into a compact recap, keep recent turns verbatim. Match the trigger to SESSION_LENGTH (long-running = earlier/more frequent).

Step 3 — Set the pruning dial
For TOOL_OUTPUT_VOLUME = yes, prune bulky tool output: truncate/summarize tool results after they have been used, drop raw dumps, keep only what later turns need. Unpruned tool output is the fastest context-bloat source.

Step 4 — Run the "agent forgot" diagnostic
If AGENT_SYMPTOM includes forgetting, trace it: was it compacted away (compaction too aggressive)? pruned too hard? never in context (system prompt did not include it)? Each cause has a different fix — diagnose before tuning.

Step 5 — Set the parameters that matter
Set the values: compaction trigger threshold, prune length cap, and prompt caching on the stable prefix (system prompt + schemas). Prompt caching the fixed iceberg is the single biggest saver because that slice is identical every call.

Step 6 — Run the 30-minute budget inspection + 6-mistake check
Inspect the live context budget, then check the six mistakes: (1) treating context as just history? (2) no compaction (bloat)? (3) compaction too aggressive (forgetting)? (4) unpruned tool output? (5) no prompt caching on the stable prefix? (6) not inspecting the budget? Fix any.

RULES:
- Context is the whole input package, not history — size all slices; the fixed iceberg dominates surprise bills.
- Two dials: compaction for long conversations, pruning for bulky tool output — both must be set.
- Diagnose "forgetting" before tuning — compaction vs pruning vs never-in-context each have different fixes.
- Cache the stable prefix (system prompt + schemas) — it is identical every call and the biggest single saver.

OUTPUT FORMAT:
Output six sections:
1. **Budget sizing** — markdown table with columns: Slice | Est. share | Fixed? (Y/N).
2. **Compaction dial** — trigger threshold + what summarizes vs stays verbatim.
3. **Pruning dial** — tool-output prune rule + cap.
4. **Forgetting diagnostic** — the traced cause (if AGENT_SYMPTOM includes forgetting) + the matching fix.
5. **Parameters** — compaction trigger + prune cap + prompt-caching on/off.
6. **Budget inspection + 6-mistake check** — markdown table with columns: Mistake | Present? (Y/N) | Fix.
Save as @templates/openclaw-context-resource.md and run when an agent gets costly or slow, then re-run whenever session length, tool output, or the system prompt changes.
Frequently Asked Questions
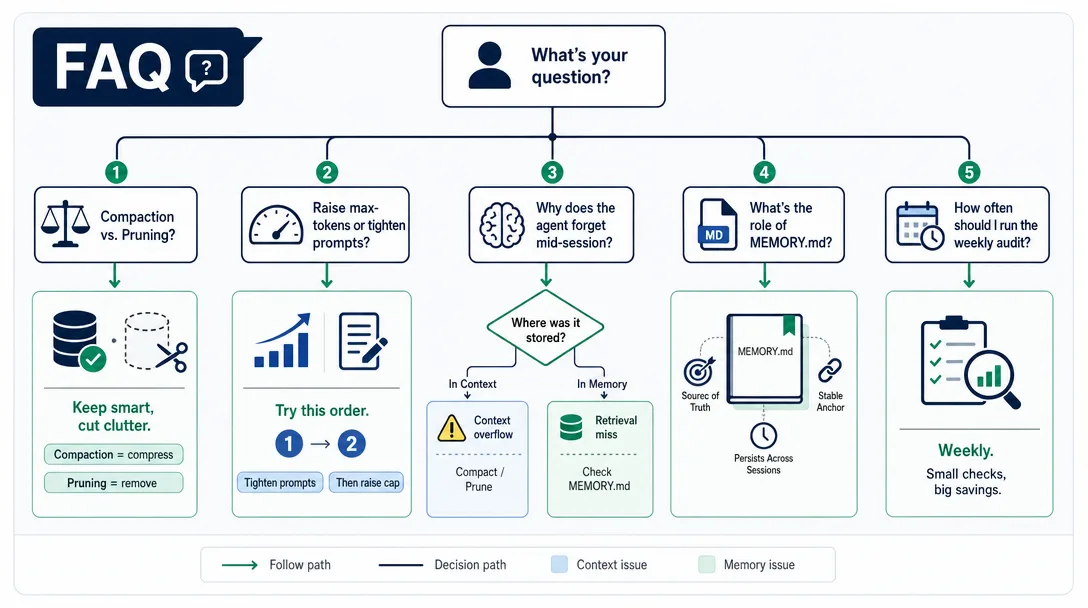
Why is context the most expensive resource in an AI agent?
Every model call sends the entire context to the API. A 60K token context costs 30x more than a 2K context, and runs noticeably slower. As an agent works, context grows on every tool call, so without active management the bill grows non-linearly. Context management is the single biggest cost lever in an agent runtime.
What is the difference between compaction and pruning?
Compaction summarizes conversation history into a shorter form when it gets long. Pruning trims tool output (logs, file dumps, search results) when it gets bulky. Compaction touches what humans said; pruning touches what tools returned. They run on different triggers and different data.
Why does my agent suddenly forget things mid-session?
Compaction may have just run. OpenClaw auto-compacts when the session nears the model context limit or when the provider returns a context-overflow error. The fix is to keep memoryFlush enabled so important facts are saved to memory files before compaction, and to write critical stable rules into SOUL.md or AGENTS.md where compaction never touches them.
How should I enable session pruning?
Use agents.defaults.contextPruning.mode = "cache-ttl" when your provider/runtime benefits from cache-TTL pruning. In current OpenClaw, pruning trims old tool results in memory and leaves the on-disk transcript intact. Do not use old round-count pruning guidance as a current config key.
How can I see how much context my agent is actually using?
Use /status for a quick view, /context list for injected files and rough sizes, /context detail for the deeper breakdown, and openclaw gateway usage-cost --days 7 for cost summaries. Do not rely on older inspect-command wording.
Closing
Two mechanisms. A few config keys. Three inspection commands. That's the whole shape of context management.
A chat product hides context entirely, you have no idea why the same question costs different amounts at different times. An agent runtime makes the budget legible: you can see what's loaded, you can see what's compacted, you can see what got pruned. Legibility is what makes the budget operable, and operable is what makes the agent affordable to run for the long haul.
One last thing. If after reading this you remember exactly one sentence, make it this: AI agent context management is a budgeting discipline, not an optimization problem. The runtime gives you a budget. Compaction and pruning are how you stay inside it. Inspection is how you know whether you are. The agents that work for years are the ones whose owners treated context as a recurring expense from day one, not the ones whose owners discovered context only after a $200 surprise bill. Treat the dials as routine maintenance. Run /context detail like you check disk space. The agent will pay you back in stability.
References
OpenClaw Context docs — official /status, /context list, and /context detail inspection flow
Gloves on, tape measure in hand — nobody types a query. Three voice surfaces for ai automation tools (terminal, Telegram, Discord), 10 TTS and 6 STT providers compared on cost and latency, plus a setup that costs nothing.
Nothing about month four is harder than month three. It is simply the month an unpaid channel starts to feel like proof of failure. Surviving it takes a cadence you can hold while earning nothing, which is a better reason to automate business processes than speed ever was.
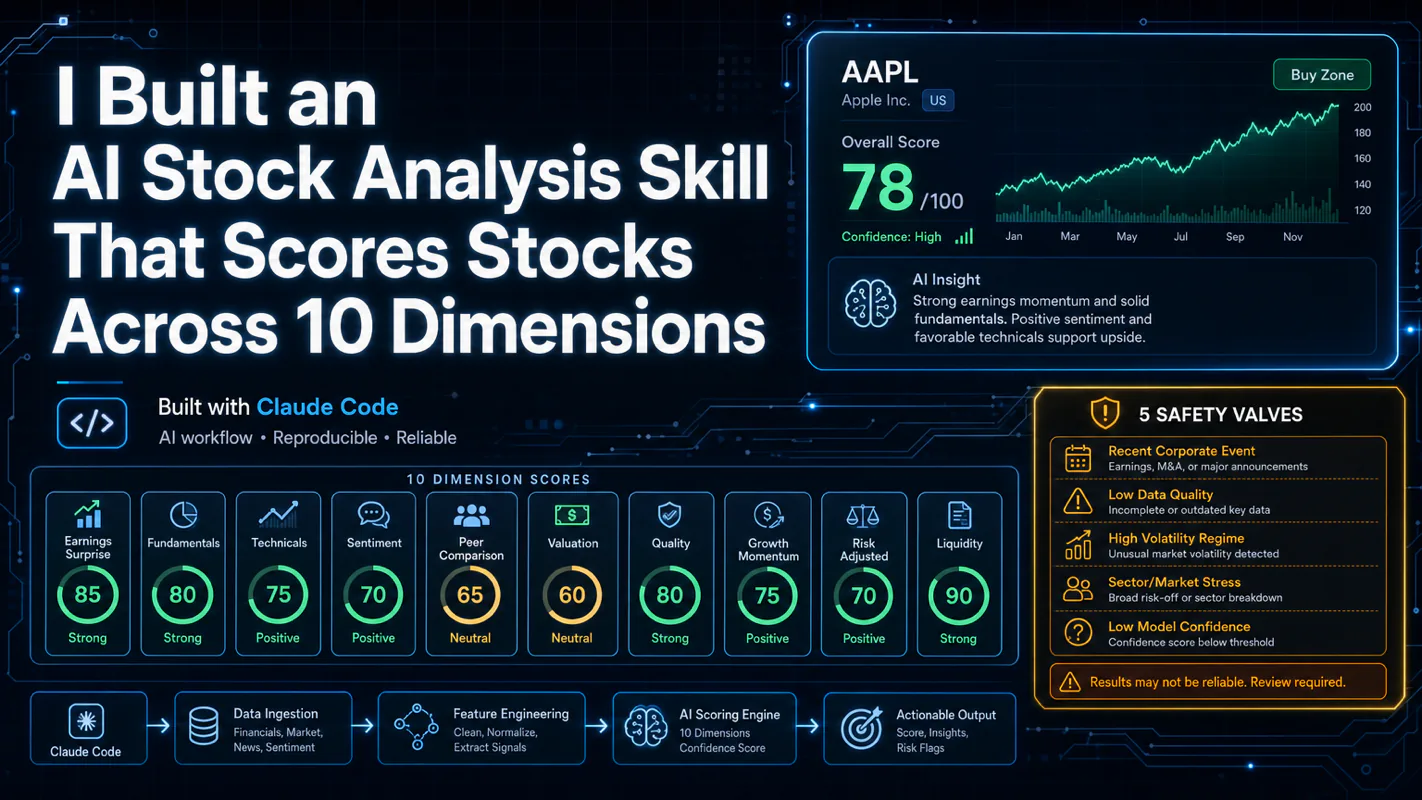
One number hides more than it shows. This Claude Code Skill scores US equities across 10 dimensions, from earnings surprise to peer comparison, with confidence scoring and 5 safety valves that flag thin data. A coding tutorial, not financial advice.
Publishing eats your week through research, SEO fields, images, and uploading — not writing. Here is the 10-step workflow automation pipeline that takes a topic to a published draft on one command, and the data contract that lets each step hand off cleanly to the next.