One prompt framework for four AI video models. Learn the 8-layer template, then adapt it to the unique controls of Runway Gen-4.5, Kling 3.0, Veo 3.1, and Seedance 2.0.
A practitioner''s image to video AI prompt guide covering the 5-element template framework, model-specific strategies for Runway Gen-4.5, Kling 3.0, Veo 3.1, and Sora 2.0, plus scene-by-scene prompt templates and common pitfalls.
Most creators treat AI image and video tools as toys. This guide maps the complete AI image video generation workflow — from structured prompts to a repeatable production pipeline that outputs publish-ready visuals and short-form videos.
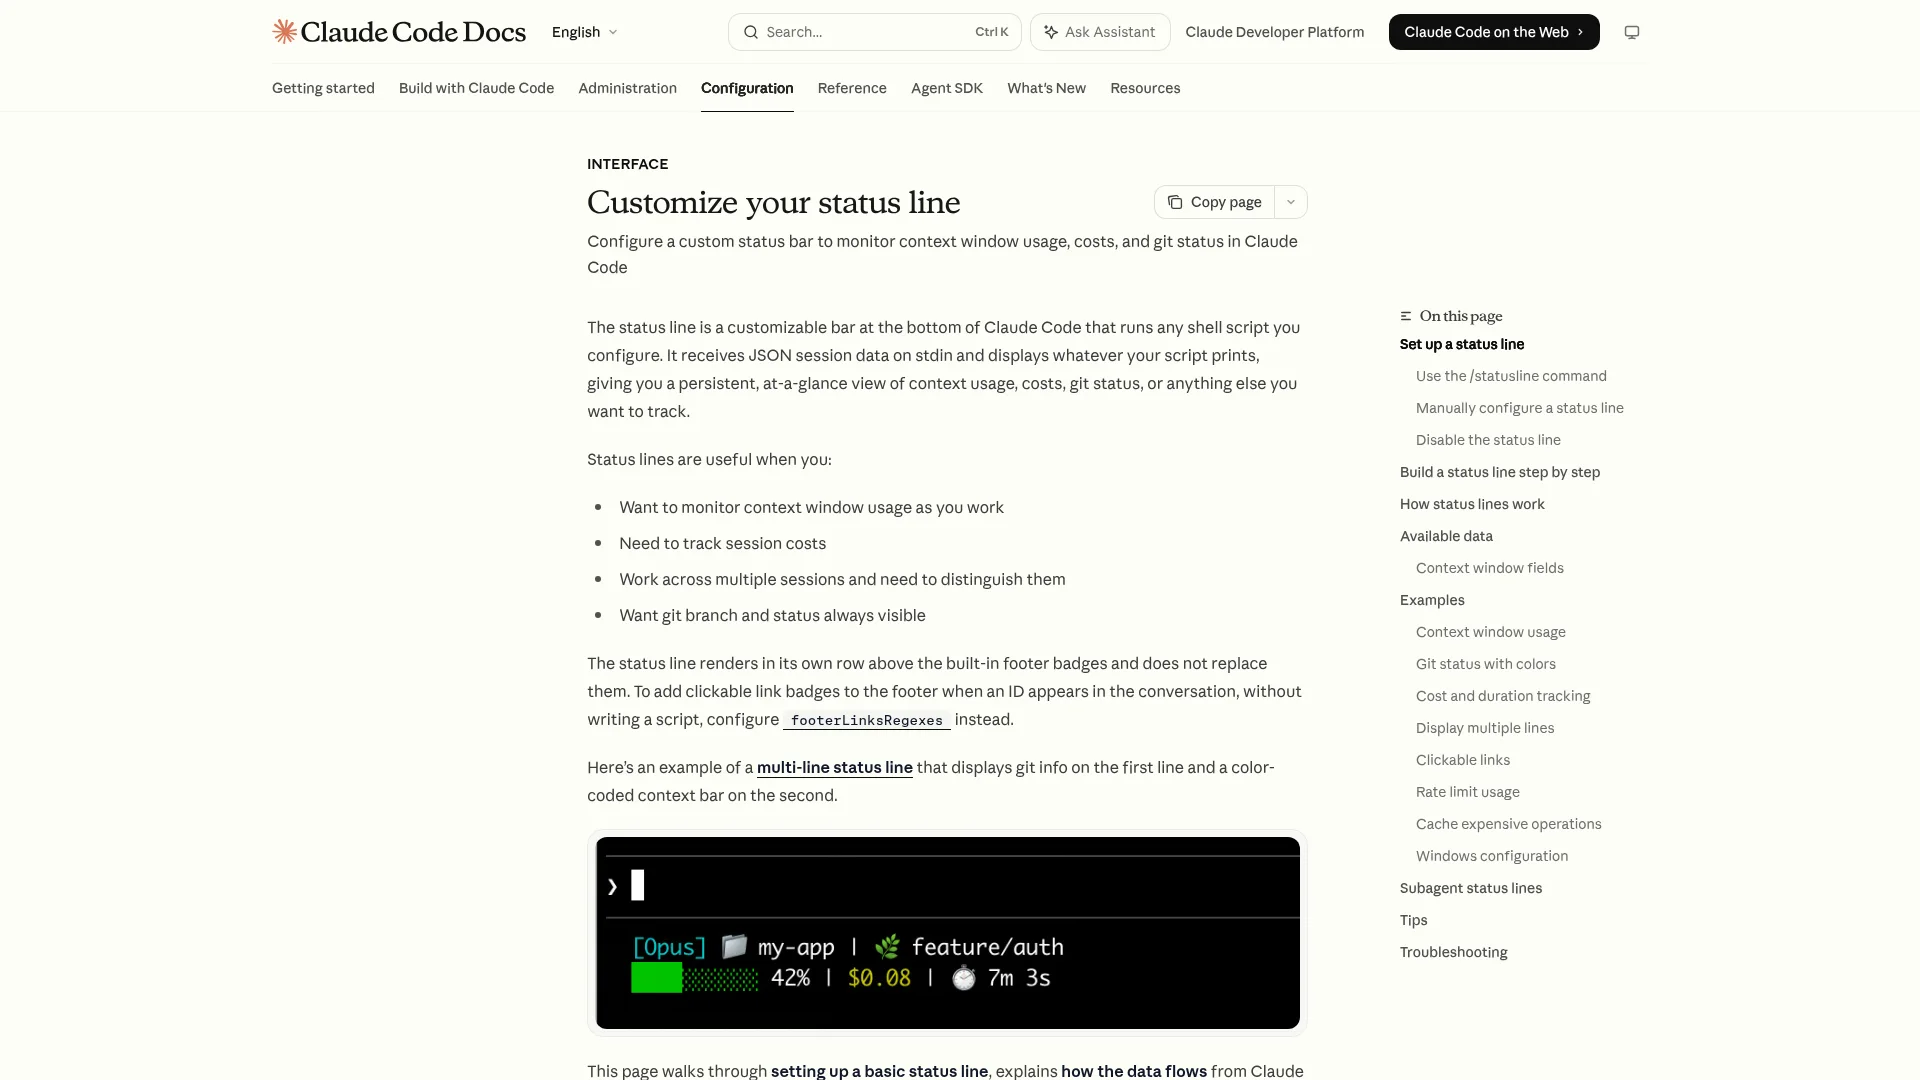
Claude Code ships blind — no context gauge, no quota counter. I built a 7-segment statusline and baked in a 50% context handoff rule, backed by Lost-in-the-Middle research. Every segment, every color rule, and the full production script explained.
The short version: — Claude Code ships blind: no context gauge, no quota counter, no sub-agent pulse. I built a 7-segment statusline that surfaces all of it in one line. The headline rule embedded in it: hand off at 50% context, not 75% — because by the time the yellow warning blinks, the middle of your reasoning chain has already gone fuzzy. Peer-reviewed research backs this, the handoff math backs this, and the production script is members-only below.
Why Is Your Terminal Driving Blind?
A fresh Claude Code install gives you an empty terminal. Nowhere on screen can you see:
How much context you've already burned
Which model is billing you right now
How close you are to your 5-hour Max quota
Whether a background sub-agent is still running
Think of it as a Formula 1 car with the instrument cluster turned off. The engine is monstrous. But you can't see fuel, RPM, or coolant temp. One full throttle later, you're in the wall.
The statusline is that missing cluster.
I shipped the first version of this script a few months back. Anthropic has been shipping Claude Code updates on a weekly cadence since, and some fields have moved. So I rebuilt it. This is v3.1.
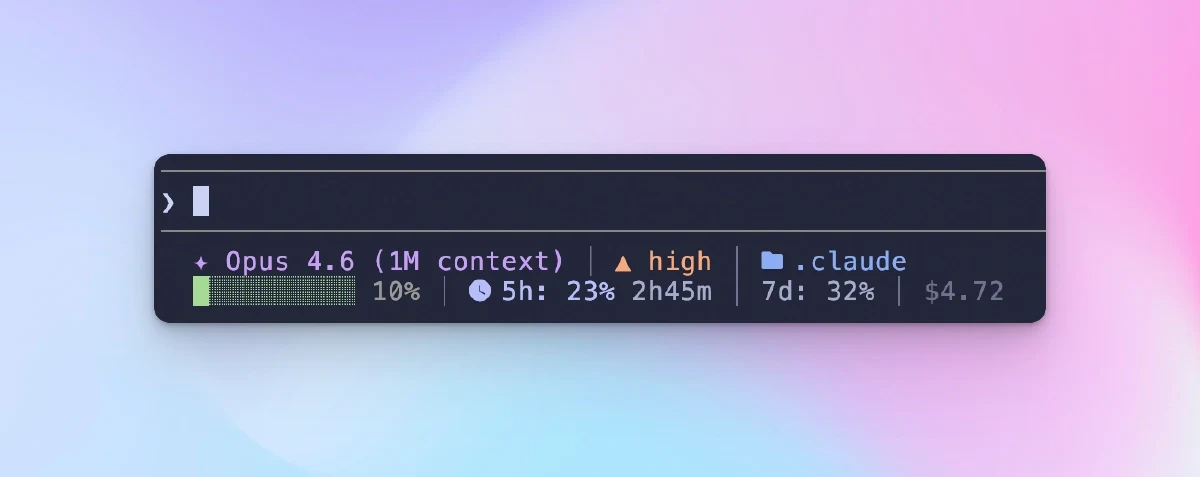
What the Statusline Shows — 7 Segments at a Glance
Four are always on (①②③⑦). The rest appear only when they carry information.
What each segment tells you at a glance
① Session · Model · Plan — which model is billing you right now, and what subscription tier you're on (Max in orange, Pro in purple).
★ My rule: pin the right model to the task.
Opus — architecture, refactors, head-scratch debugging
Sonnet — day-to-day coding, docs, code review
Haiku — format conversion, simple queries
Keeping the model visible is deliberate. It's too easy to /model out of Opus for one task and forget three hours later. That's money on fire.
② +N -M — cumulative lines added and removed this session.
The blast radius. A 50-line change and a 2,000-line change are different risk classes — the first is a cheap git checkout -- ., the second without a mid-session checkpoint commit is a timed bomb. I commit whenever this counter passes +1500 without a save.
③ Context bar — context-window usage as a percentage, with a colored bar.
%
Color
0–74%
🟢 Green
75–89%
🟡 Yellow
90–100%
🔴 Red
Those are the stock thresholds. My own habit runs much more aggressive — §3 is dedicated to why.
④ 5h / 7d Quota — real utilization of your Anthropic rolling subscription windows, plus a reset countdown.
%
Color
0–49%
🔵 Blue
50–79%
🟣 Purple
80–100%
🌸 Hot pink
Cool-toned deliberately — the warm bar is your budget, the cool bar is Anthropic's budget. Your eyes don't confuse them. At 100% the whole segment flips red: ⚠ Quota Full 23m.
⚠ macOS only. Subscription accounts only. API-key users and non-Anthropic proxy hosts see this segment hide itself automatically — the token never leaves api.anthropic.com.
⑤ Todo progress — three states: all done (✓ 3/3), in progress (▸fix-login 1/3), or pending (☐ 0/3).
⑥ Sub-agent — currently running sub-agents (up to two), formatted ⚡code-reviewer review auth module in orange. If you're inside a sub-agent session yourself, this segment shows your own agent name.
⑦ Version — Claude Code version in dim gray. Breaking changes ship on a weekly cadence, and matching the version on screen to the version in a bug report saves a round-trip.
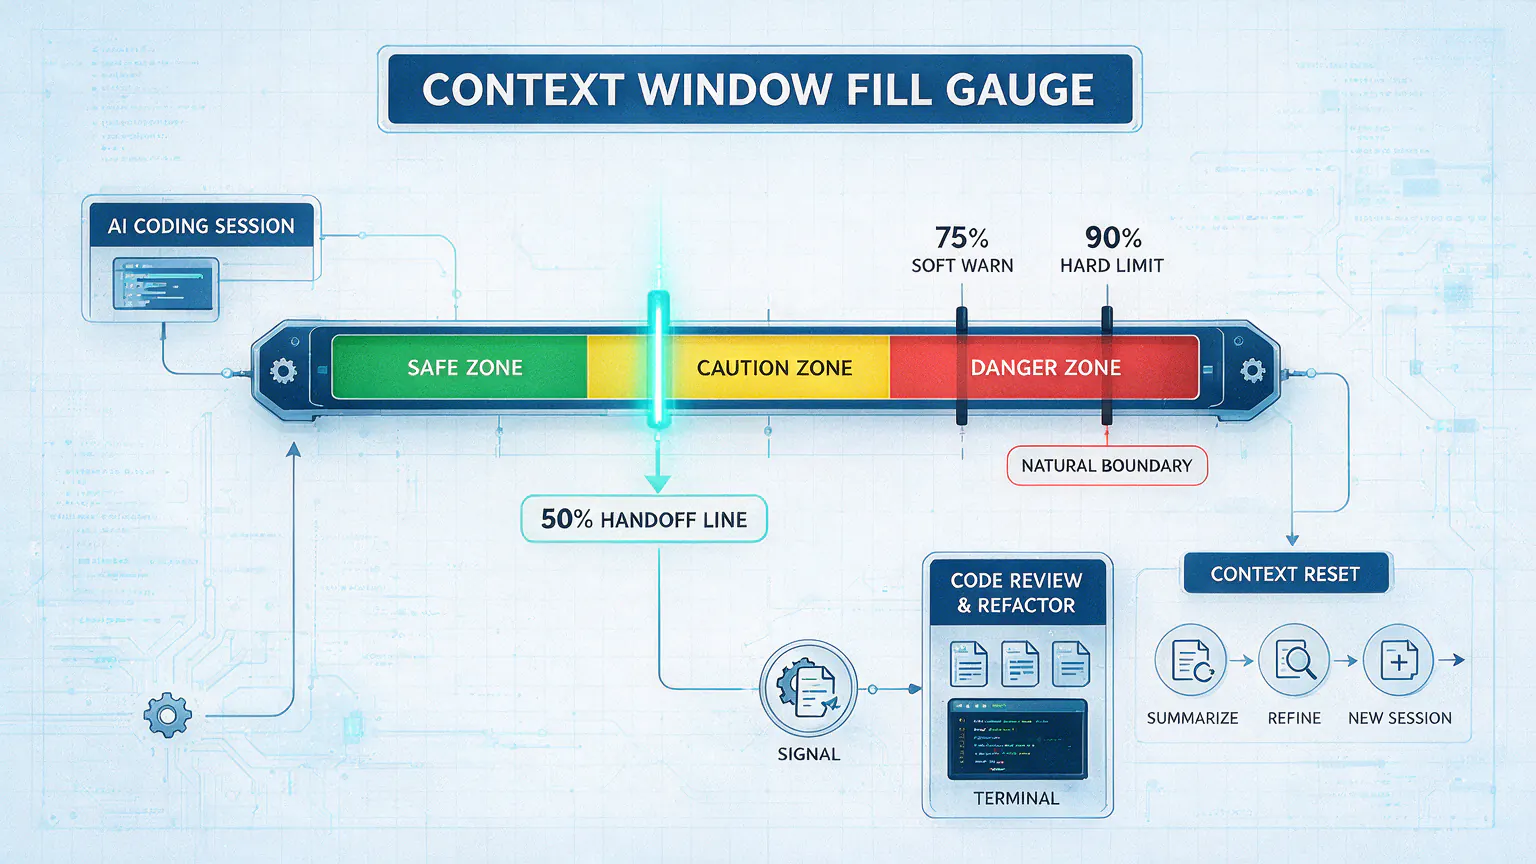
The 50% Handoff Line — My Cockpit Rule
Source default: yellow at 75%, red at 90%. I hand off at 50%.
If you poll ten Claude Code users on when they hand off, most will say 90%, or "when the response starts drifting." I call that too late. Here's why.
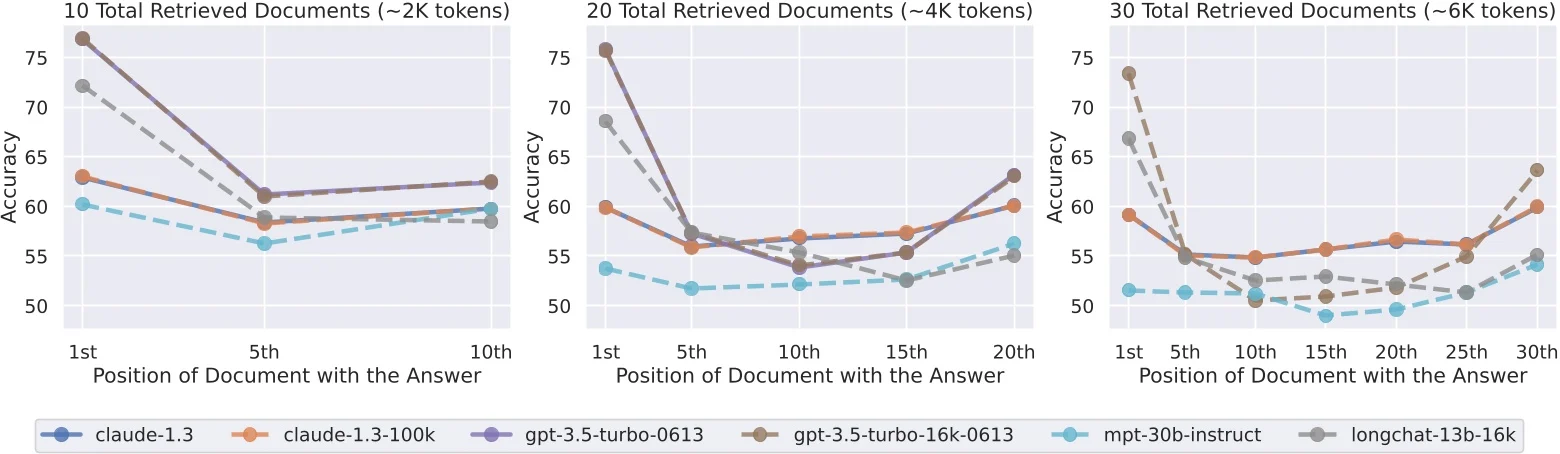
Reason 1: Lost-in-the-Middle is a real effect, not an anecdote
Liu et al., TACL 2024 — a peer-reviewed paper — showed that as context length grows, the model's ability to retrieve information from the middle of that context degrades faster than its grasp of the beginning or the end. The U-shape is real across model families and model sizes.
In practical terms: the architectural constraint you gave Claude in turn 3, the file layout you explained in turn 7, the "always use TypeScript strict mode" rule you set at the top — all of these get fuzzy by turn 40 in a long session. Claude read them. It's just not weighting them anymore.
This is an architectural property, not a bug to be patched. The only workaround is not letting the context get there.
The community corroborates this from the symptom side. From r/ClaudeAI [1]:
"Once it hits the limit and does a 'compact,' the responses start subtly drifting off the rails. The compacting process straight-up nukes crucial context."
Another thread [2] describes a user who hand-offs at 90%:
"When context usage hits ~90%, I ask Claude Code to automatically create a handoff document with the current progress, project state, and next steps."
Good instinct, wrong timing. 90% is deep inside the drift zone. If your plan was already fuzzy at 60%, the handoff document you write at 90% encodes that fuzziness. Garbage in, garbage out.
Reason 2: Handoff cost < Rework cost
Rough math I've lived:
Choice
Cost
Hand off at 50%
~5 minutes writing a summary + open a fresh session
Let it drift to 80–90%, catch the regression, roll back
Potentially a whole night of code discarded + rewriting tomorrow
One is a certain small cost. The other is an occasional catastrophic one. Over a month of serious Claude Code use, the first wins by a landslide.
📌 This is my habit, not a law.
The script ships with the stock 75 / 90 thresholds. If 90% works for you because you run shorter sessions, keep it. The statusline's job is to show the gauge, not to dictate the shift point.
Build It Yourself, or Grab Mine
A sharp Claude Code user could probably ask Claude to build a version of this bar in an afternoon. The basic gauges would render.
What breaks is what you don't know to ask for. In six weeks of running this on my own machine, I hit all four:
Your proxy drops mid-session and the script keeps hammering api.anthropic.com with your real IP attached
You get rate-limited once and the bar goes blank until you clear a cache you didn't know existed
Five concurrent Claude Code sessions fire the OAuth API in the same second and blow past your quota estimate
Your OAuth token expires silently and the segment shows nothing until you rotate it
Ship your own and keep patching. Or grab mine, below.
Ready-to-Use Prompt: Design a 7-Segment Claude Code Statusline With the 50% Handoff Rule
What this does: Designs a 7-segment statusline that surfaces Claude Code's blind spots, bakes in the 50% context-handoff rule (not 75%) with circuit breakers, handles weekly-update failure modes, and fits the segments to how you actually work. Based on: Claude Code Statusline: The 50% Handoff Line — https://aiworkflowpro.com/claude-code-statusline/ Time to run: ~4 minutes
Copy this prompt into Claude Code, ChatGPT, or any AI assistant:
ROLE: You are a Claude Code cockpit designer. Your job: build a 7-segment statusline that stops the terminal driving blind, and bake in the 50% context-handoff rule with circuit breakers and a failure-mode plan.

CONTEXT — 50% HANDOFF STATUSLINE:
A fresh Claude Code install is blind: nowhere on screen do you see context burned, which model is billing, how close you are to the 5-hour quota, or whether a sub-agent is still running — a Formula 1 car with the instrument cluster off. The fix is a 7-segment statusline, and its headline rule is the 50% handoff: hand off context at 50%, not 75%. By the time the default 75% warning blinks, the middle of the reasoning chain has already gone fuzzy — Lost-in-the-Middle research shows the center of a long context degrades even when head and tail look fine. Circuit breakers turn the gauge into automatic action; a failure-mode matrix covers what breaks.

INPUTS (fill in before running):
- USAGE_PROFILE: YOUR_USAGE_HERE (how you use Claude Code — long single sessions / many short tasks / heavy sub-agents / quota-constrained)
- HANDOFF_TARGET: YOUR_HANDBACK_HERE (what "handoff" means for you — compact / new session / written handoff doc)
- QUOTA_TIGHTNESS: YOUR_CONSTRAINT_HERE (how tight your 5-hour quota is — loose / tight)

METHOD — 6 STEPS:

Step 1 — Choose the 7 segments
Pick segments prioritizing the blind spots: context burned (%) · active model + billing tier · 5-hour quota proximity · sub-agent pulse · working dir + git branch · session cost/tokens · handoff warning. Drop or swap one only if USAGE_PROFILE makes it irrelevant; never drop the context-burned segment.

Step 2 — Set the 50% handoff rule
Make 50% context the handoff trigger, not 75%. Reason: Lost-in-the-Middle degrades the center of a long context before the default warning fires, so by 75% the reasoning chain's middle is already fuzzy. Define HANDOFF_TARGET as the action fired at 50%.

Step 3 — Wire the circuit breakers
Define auto-actions: at 50% context → fire HANDOFF_TARGET; at 80% quota proximity → throttle or pause; sub-agent pulse stale > N min → flag. A gauge without a breaker is decoration — every red segment triggers an action.

Step 4 — Handle the failure modes
Build the failure-mode matrix: a segment field moves or vanishes after a weekly Claude Code update → degrade gracefully, show "—", do not crash; quota field unavailable → hide segment; sub-agent pipe stuck → timeout and flag. No statusline failure may block the terminal.

Step 5 — Fit to usage profile
Adjust for USAGE_PROFILE: long single sessions → foreground context + handoff; many short tasks → foreground cost + quota; heavy sub-agents → foreground sub-agent pulse; quota-constrained → foreground quota proximity and lower the handoff threshold if needed.

Step 6 — Validate
Check: (1) does context burned always show? (2) does the 50% breaker fire the handoff? (3) does every red segment have an action? (4) does the script degrade gracefully on a field change? (5) is install under 60 seconds? Fail any → fix.

RULES:
- Hand off at 50% context, never wait for 75% — the reasoning middle is already fuzzy by then.
- Context burned is always visible; it is the one segment never dropped.
- Every red/warning segment fires an action — a gauge with no breaker is decoration.
- The statusline degrades gracefully on weekly Claude Code updates; it never blocks the terminal.

OUTPUT FORMAT:
Output six sections:
1. **7 segments** — markdown table with columns: Segment | What it shows | Priority for USAGE_PROFILE (high/med/low).
2. **50% handoff rule** — the threshold + the Lost-in-the-Middle reason + the HANDOFF_TARGET action.
3. **Circuit breakers** — markdown table with columns: Trigger | Threshold | Auto-action.
4. **Failure-mode matrix** — markdown table with columns: Failure | Graceful response.
5. **Usage-profile fit** — which segments are foregrounded for USAGE_PROFILE + any threshold change.
6. **Validation** — markdown table with columns: Check | Pass? (Y/N).
Save as @templates/claude-code-statusline.md and run when you first build the statusline, then re-run after each Claude Code weekly update that moves a status field.
Frequently Asked Questions
Q: Will this work on Linux or Windows?
Partially. The bar runs anywhere Python 3.8+ does. The 5h / 7d quota segment is macOS-only (the Keychain read is Apple-specific). Everything else — context bar, todos, sub-agents, code delta — is cross-platform.
Q: Why 50% specifically? Why not 40%, 60%, or 70%?
Below 40% you're leaving too much working memory on the table. Above 60% you're sliding into the middle-fuzz zone. 50% is a convenient midpoint with room for real work plus headroom for the long tail. It's a heuristic, not a constant — I've pushed to 60% on simple sessions and cut to 40% on ones with heavy early context I really needed preserved.
Q: I use an API key, not a subscription. Will this help me?
You'll get 6 of the 7 segments. The quota segment simply hides itself. The context bar — the segment that matters most — is fully functional regardless.
Closing
Claude Code is a ridiculously capable instrument — the default terminal just hides every gauge. The statusline uncovers them.
The 50% rule is my preference. The 7 segments are your dashboard. The philosophy is yours to keep.
Hand off early. Ship confidently.
— Leo
Production Source Below
Everything above this line is yours, free. Read it, share it, use the 50% rule.
Below this line is the file I actually run on my own machine — 950 lines of Python, zero third-party dependencies, production-hardened against the four edge cases in §4. Free download in the next section.
What's inside
awp-dev-statusline-svc.py — the full script (~950 LoC, stdlib only)
What the production build has that a one-shot rebuild misses
Circuit breaker with per-error thresholds — 6-hour lockout on proxy drop so your real IP never leaks to api.anthropic.com
last_good snapshot fallback — rate-limits don't blank the bar; you keep seeing real percentages annotated with the error and age
Atomic file locking — five concurrent Claude Code sessions can't thrash the cache
Defensive parsing at every external input boundary (stdin JSON, Keychain payload, OAuth response, transcript JSONL)
10-dimension static audit + 20-test dynamic suite, all green
What the deep-dive below covers
How it actually works under the hood — OAuth + Keychain three-step flow, why 64 KB is the right transcript tail window, the cool-vs-warm palette engineering
The subscription tier (Max / Pro) comes from a single /usr/bin/security find-generic-password -s 'Claude Code-credentials' -w call. Claude Code stores the OAuth token in macOS Keychain on login, and the subscription type ships alongside the token in the same JSON blob. Free information — if you know where to look.
④ 5h / 7d Quota — the three-step flow
Read the OAuth access token from macOS Keychain (same security call)
Call the Anthropic usage API — GET https://api.anthropic.com/api/oauth/usage with header anthropic-beta: oauth-2025-04-20
Cache the response for 5 minutes under ~/.claude/.hud-cache/usage-cache.json, alongside a last_good snapshot and circuit-breaker state
The response returns five_hour.utilization and seven_day.utilization as 0–100 integers, plus reset timestamps. One API call per 5-minute window, per project, per machine.
Cool-tone palette engineering — blue → purple → hot pink exists in deliberate contrast to the warm context bar in §③. Warm = your budget. Cool = Anthropic's budget. If both bars used green-to-red, peripheral vision would conflate them. Two palettes, two budgets, zero confusion.
⑤ Todo progress — why 64 KB
Claude Code writes every tool call to a JSONL transcript at ~/.claude/projects/…/*.jsonl. A long session's file runs into the megabytes. Reading it end-to-end every 300 ms would be absurd.
64 KB from the tail is empirically enough for the live todo set — that's 20+ entries, and todos that scrolled past are stale by definition. The script seeks to fsize - 65536, drops the first partial line (might be mid-JSON), then parses each subsequent line. Malformed lines skip silently; no single bad line can crash the bar.
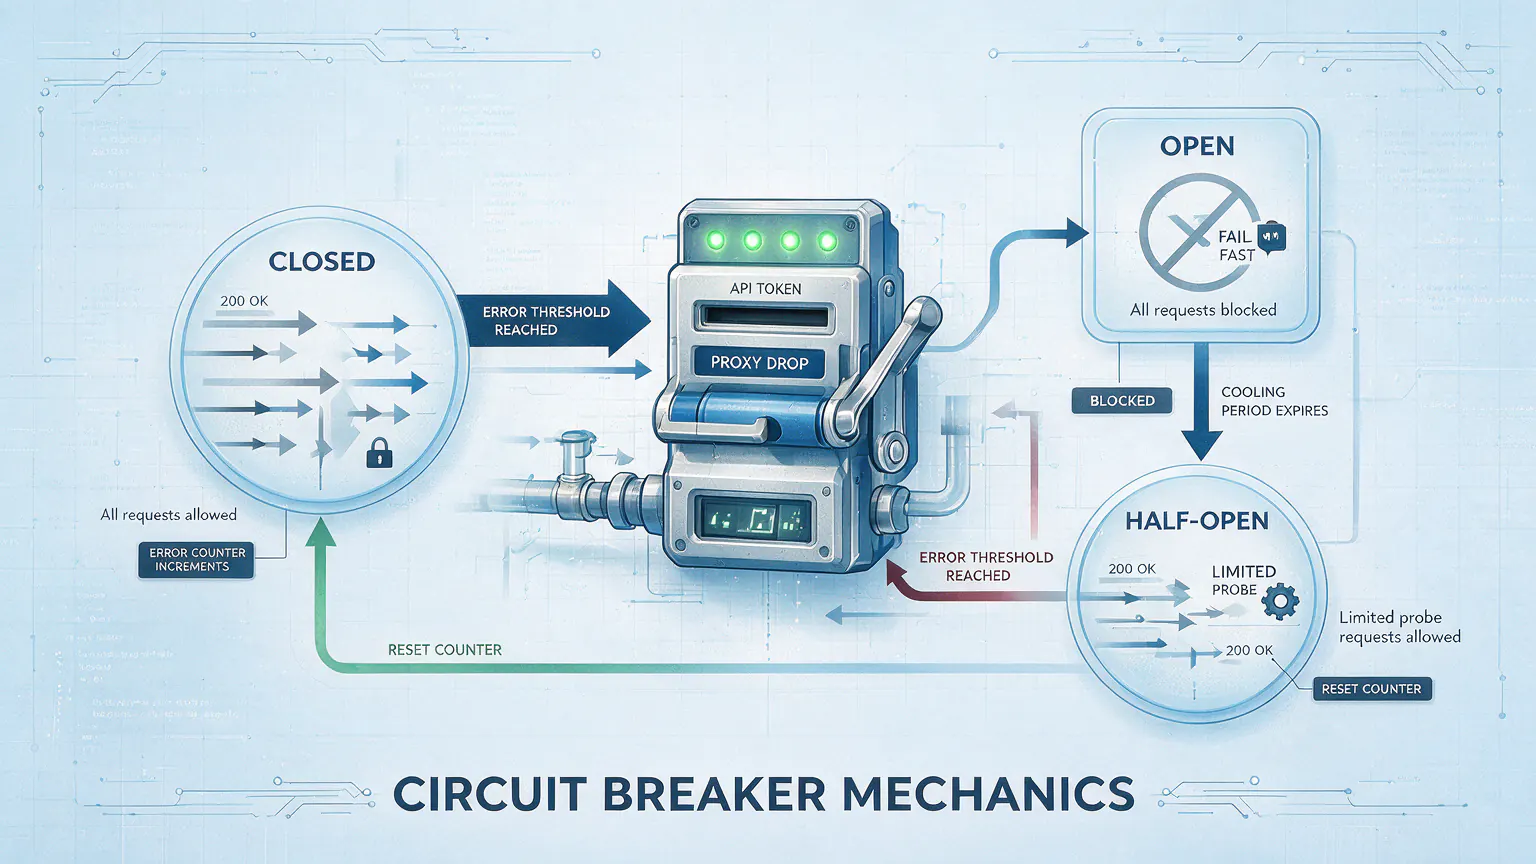
Circuit Breaker Mechanics
Naive retry loops under failure cause three harms:
Real-IP exposure — proxy is down but the script still hits api.anthropic.com
Server-side throttle amplification — cache never refreshes
Wasted resource cycles
The breaker classifies errors and trips open at per-error thresholds:
Error code
Threshold
Open window
Rationale
network (DNS/TCP failure)
2
6 hours
Aggressive real-IP protection on proxy drop
http-401 / http-403
1
∞ (manual fix)
Token invalid, user must re-auth
rate-limited (HTTP 429)
3
1 hour
Server throttle
parse / unknown / http-5xx
5
30 minutes
Fallback
Backoff schedule before the circuit opens: 30s → 120s → 600s → 1800s → 7200s.
Half-open probe: when the open window expires, the next request is a probe. Success fully closes the breaker; another failure reopens it for a fresh window.
last_good fallback: every successful fetch saves a snapshot. During errors the bar keeps showing real percentages — 5h 47% 7d 77% (Rate-limit · 3m ago) — so one glitch can't blind you.
Failure Mode Matrix
Scenario
Statusline shows
API calls emitted
Normal
5h 47% 7d 77% 2h13m
1 per 5 min
1–2 rate-limits
5h 47% 7d 77% (Rate-limit · Nm ago)
backoff 30s → 10 min
3 consecutive rate-limits
5h 47% 7d 77% (Paused · Rate-limit · Nm ago)
0, circuit open 1 h
Proxy dropped (2 network errs)
5h 47% 7d 77% (Paused · Network · Nm ago)
0, circuit open 6 h
Token 401/403
Quota: Paused · Token Invalid (red)
0, manual re-auth
No snapshot + circuit open
Quota: Paused · Network
0
Install in 60 Seconds
Drop the folder anywhere, e.g. ~/bin/claude-statusline/. No chmod, no dependencies.
⚠️ commandmust use an absolute path. ~ and $HOME are not expanded.
Restart the session. The bar appears at the bottom. First activation pulls the OAuth usage API once and caches for 5 minutes — idle traffic after that is zero.
Full recipes (cache inspection, manual circuit reset, common-issue matrix, uninstall steps) live in CLAUDE.md inside the zip. The same file documents the full runtime contract — if you ever modify the script, every security invariant you must preserve is listed there.
[3] Liu, N. F., et al. (2024). Lost in the Middle: How Language Models Use Long Contexts. Transactions of the Association for Computational Linguistics (TACL).
Your agent isn't forgetful. It was never given a role. The most future-proof agent persona is a file you load as a role — expertise, judgment, and tool portability in one primitive no update can break.
A hands-on tutorial for turning RSS feeds into an AI-powered daily briefing with Claude Code or Codex. Includes 5 copy-paste prompts, a 4-tier setup guide, and a monitoring + RAG workflow — no API keys required.
How I designed a mobile AI video editing workflow entirely from my phone -- architecting an 8-step pipeline with voice input, remote tmux, and no laptop.
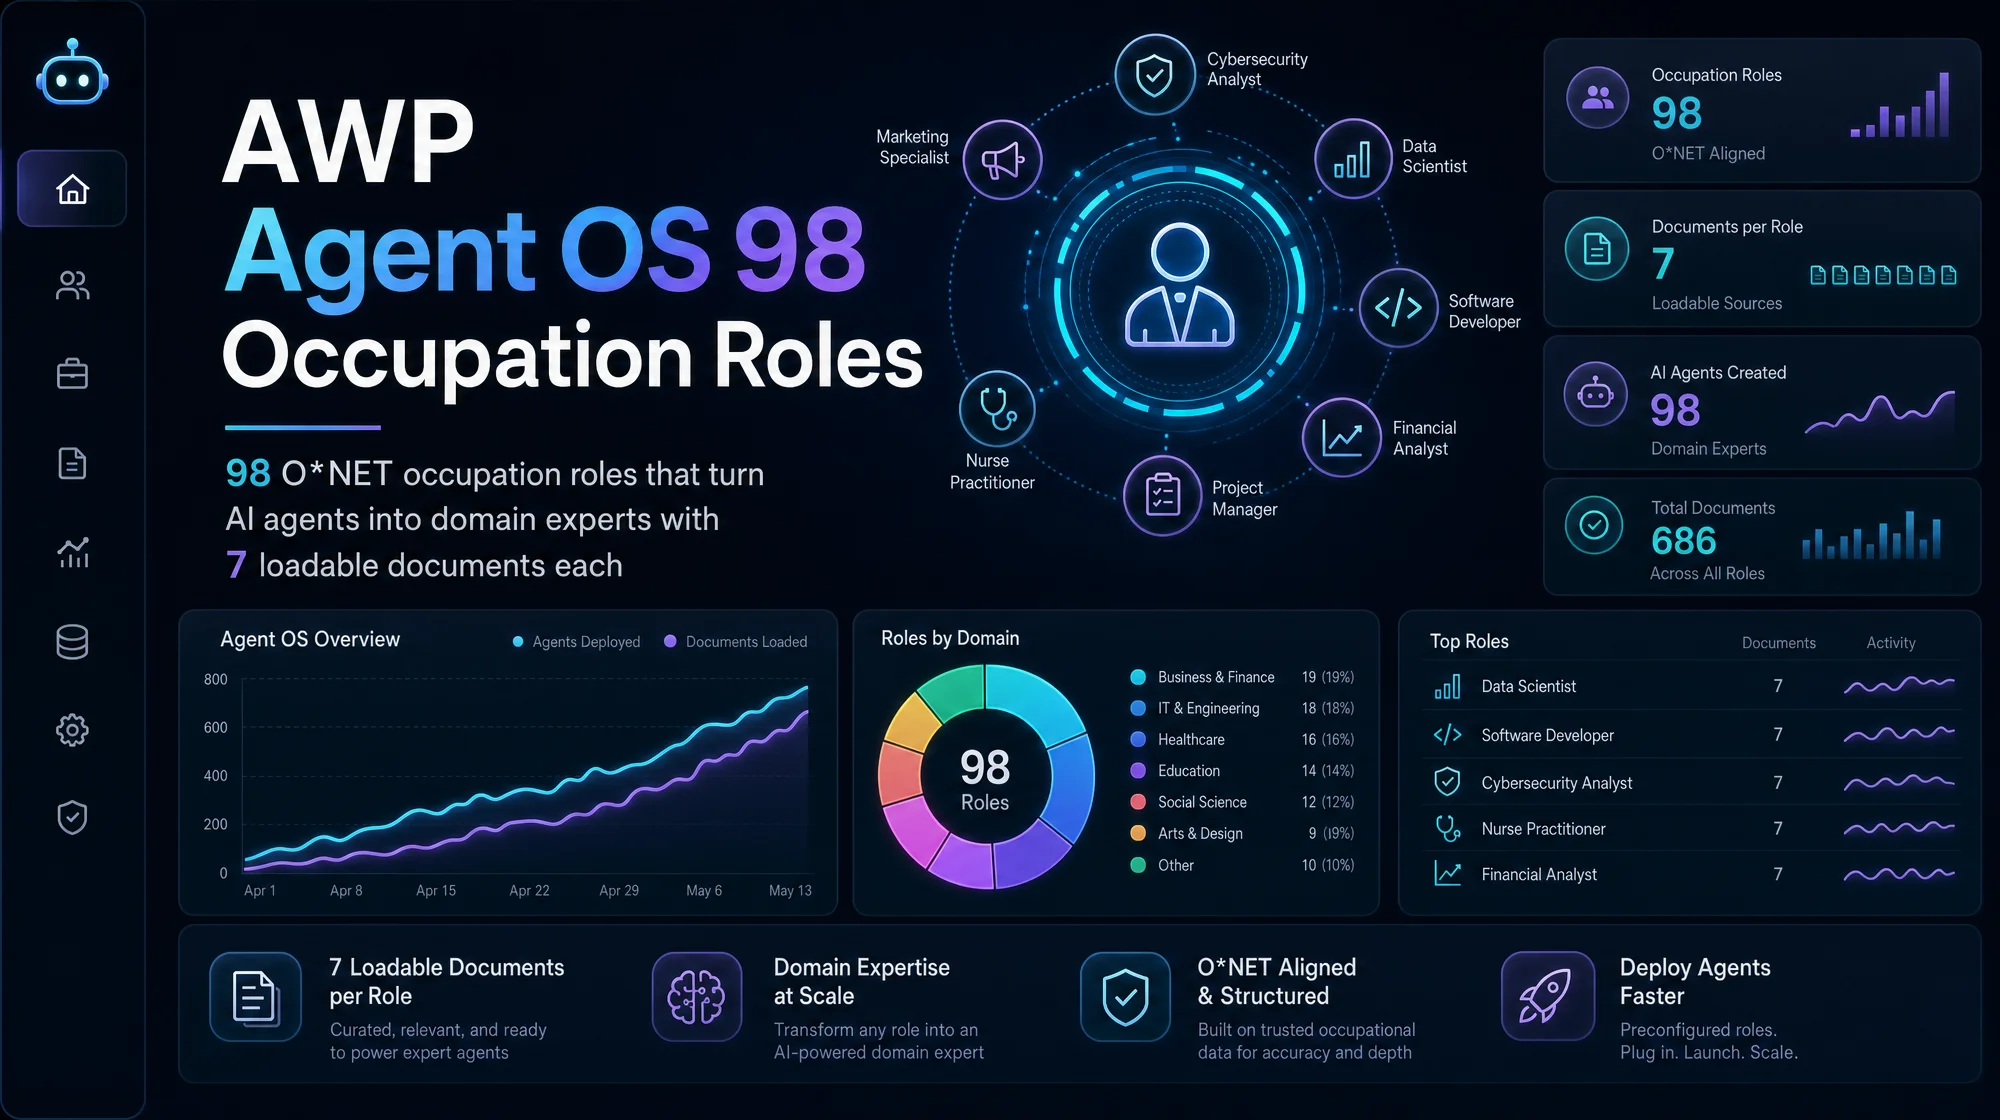
AWP Agent OS compresses decades of professional expertise into 7 loadable documents per occupation. 98 roles, grounded in O*NET 30.3 data and cognitive science research. Works with Claude Code, Codex, Gemini CLI, and GitHub Copilot.